
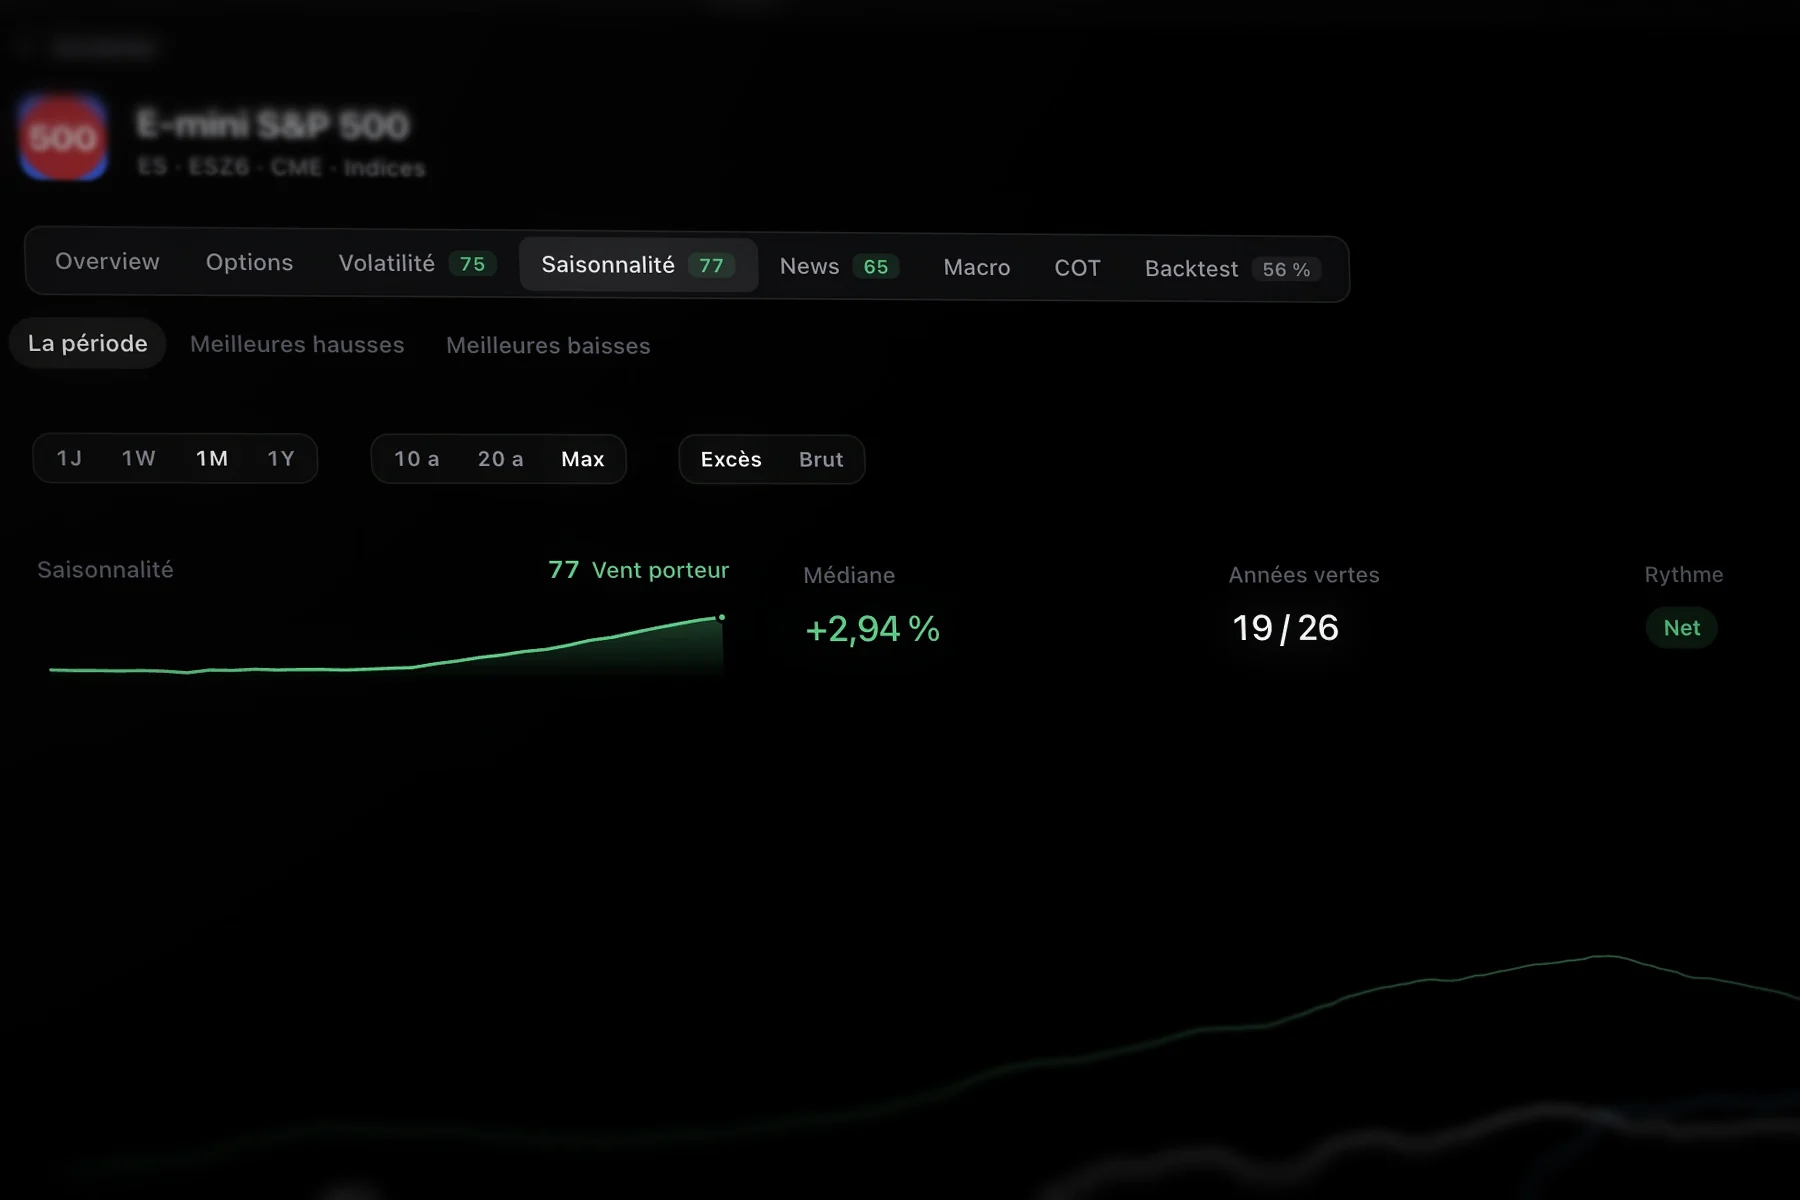
The season score.
Tailwind, median, green years.
Each market’s recurring trends, year after year: the median, the green years, the best windows ahead.
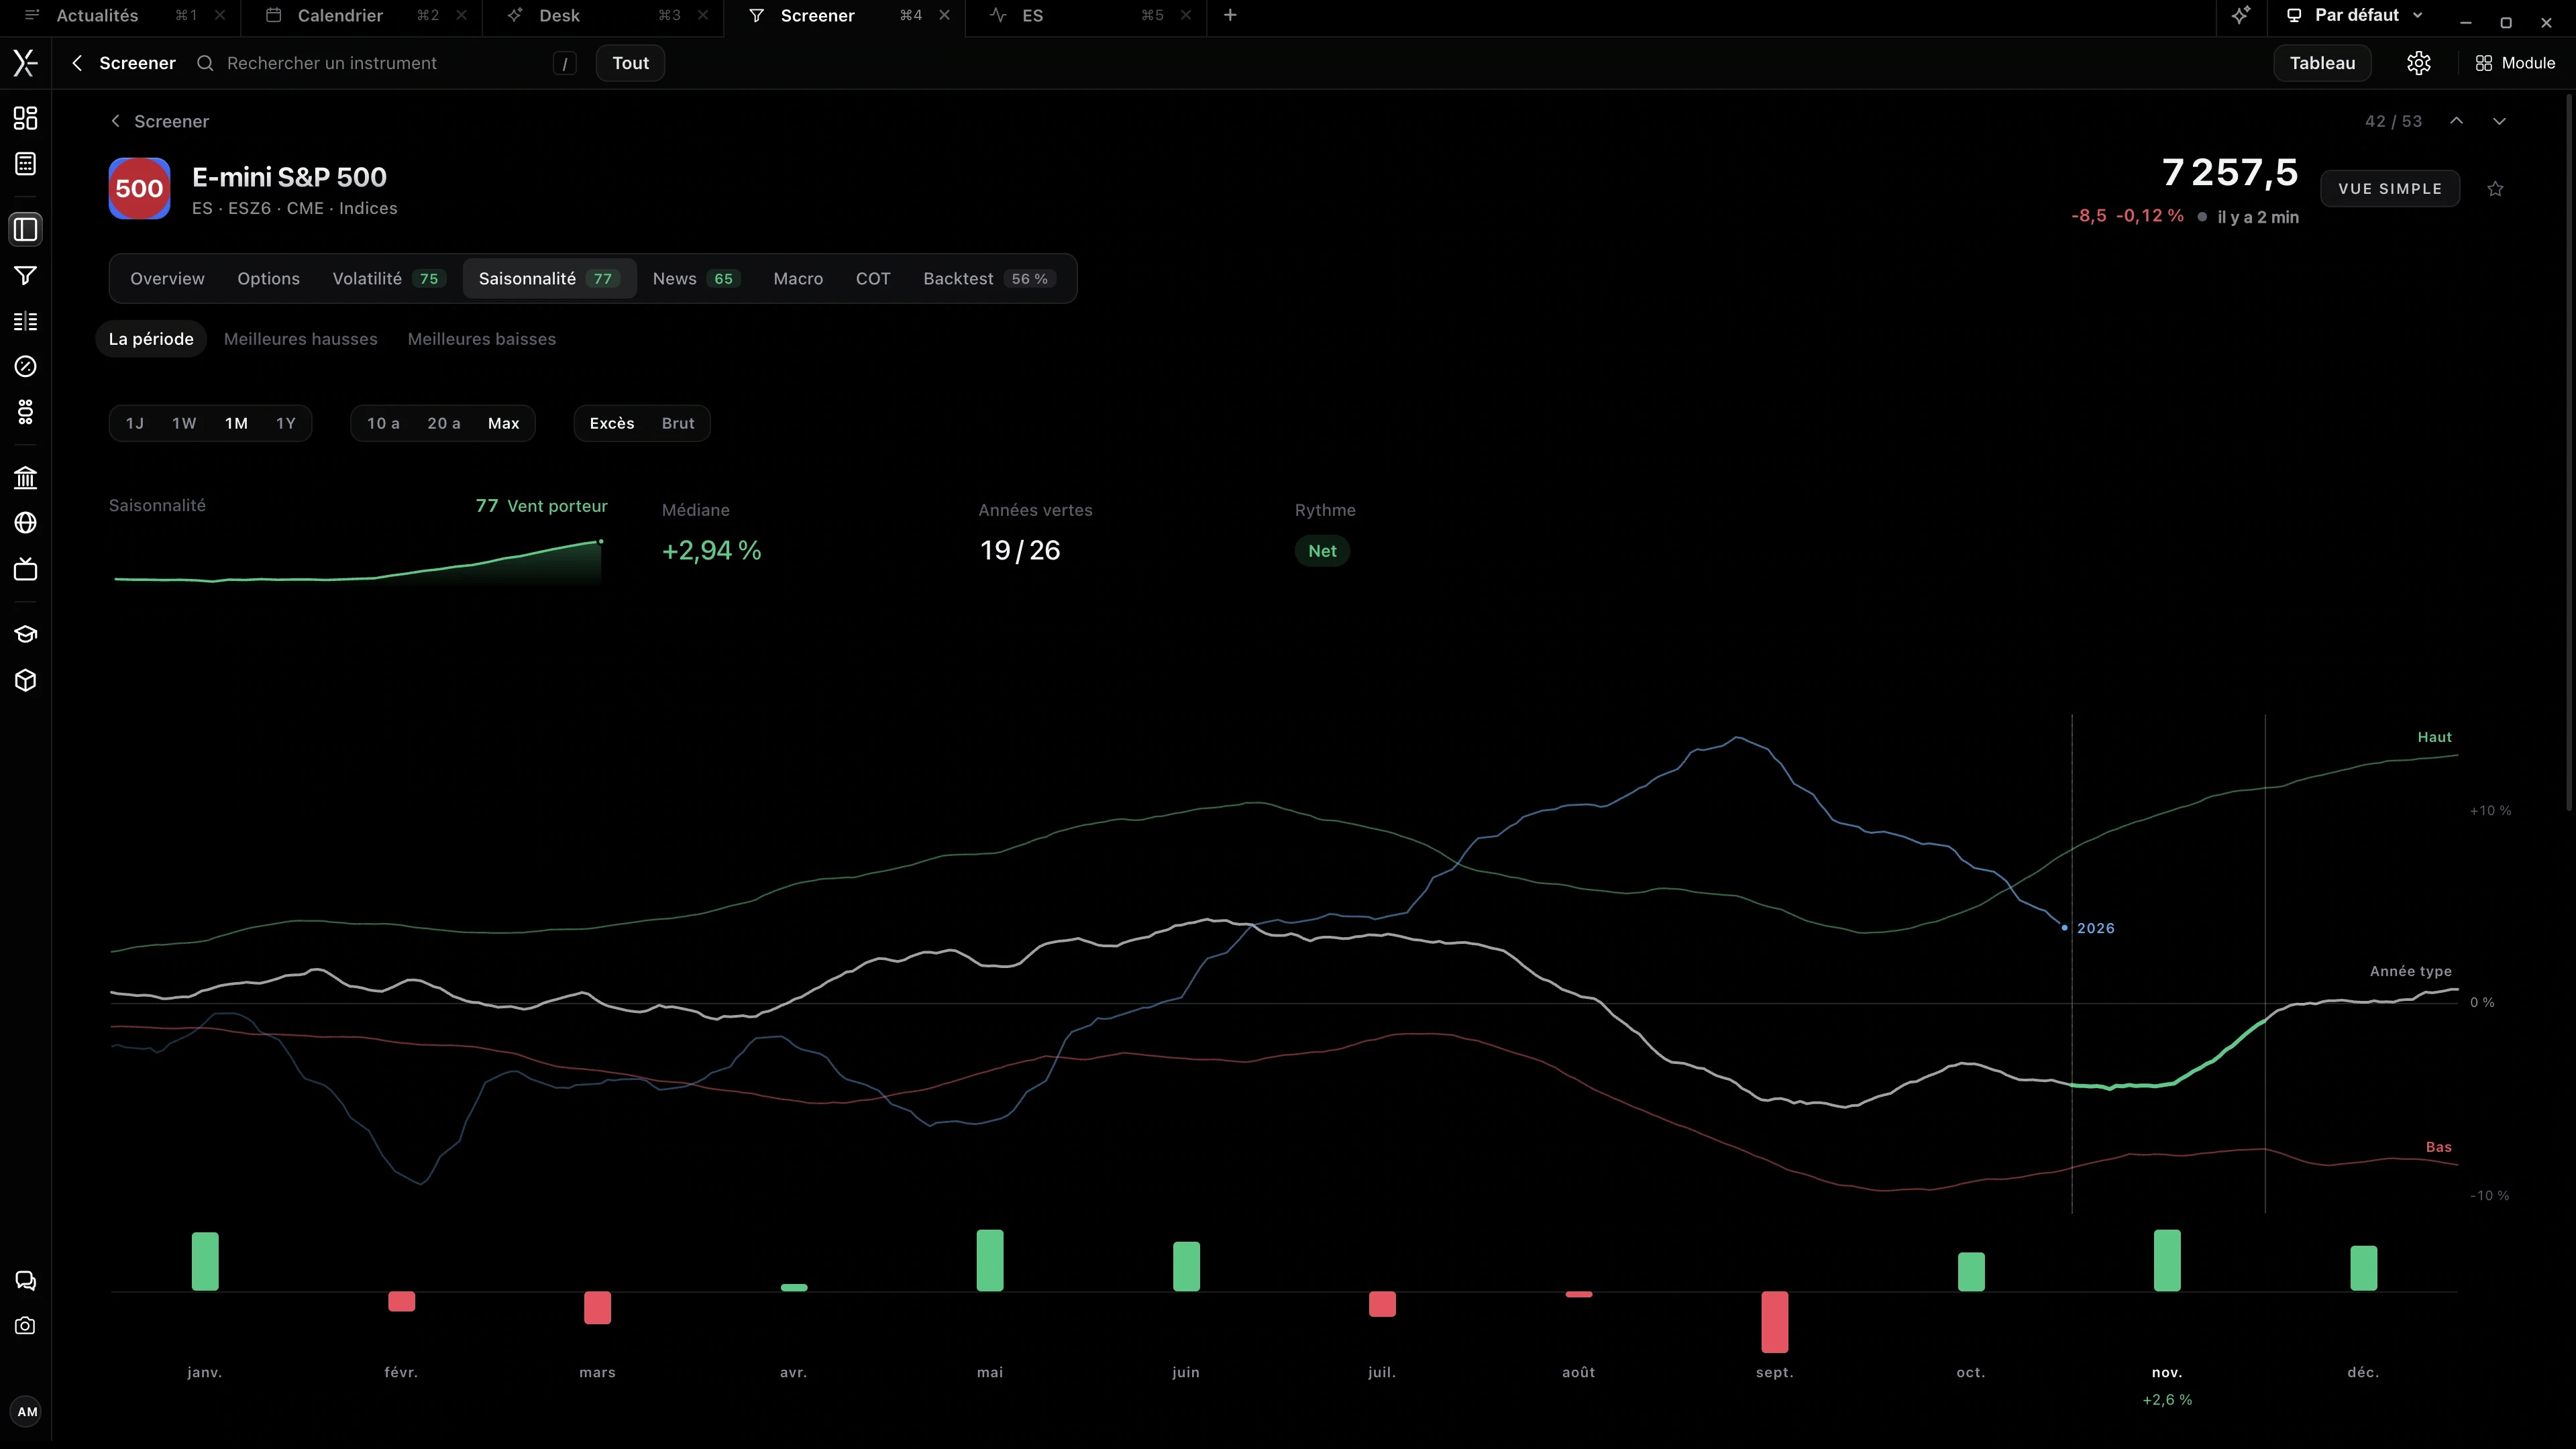
The score, the median, the green years.
Tailwind: the season is favorable.
The 26-year median, with the current year on top.
The months that rise, the ones that fall.
What the period did, every year.
Tailwind, median, green years.
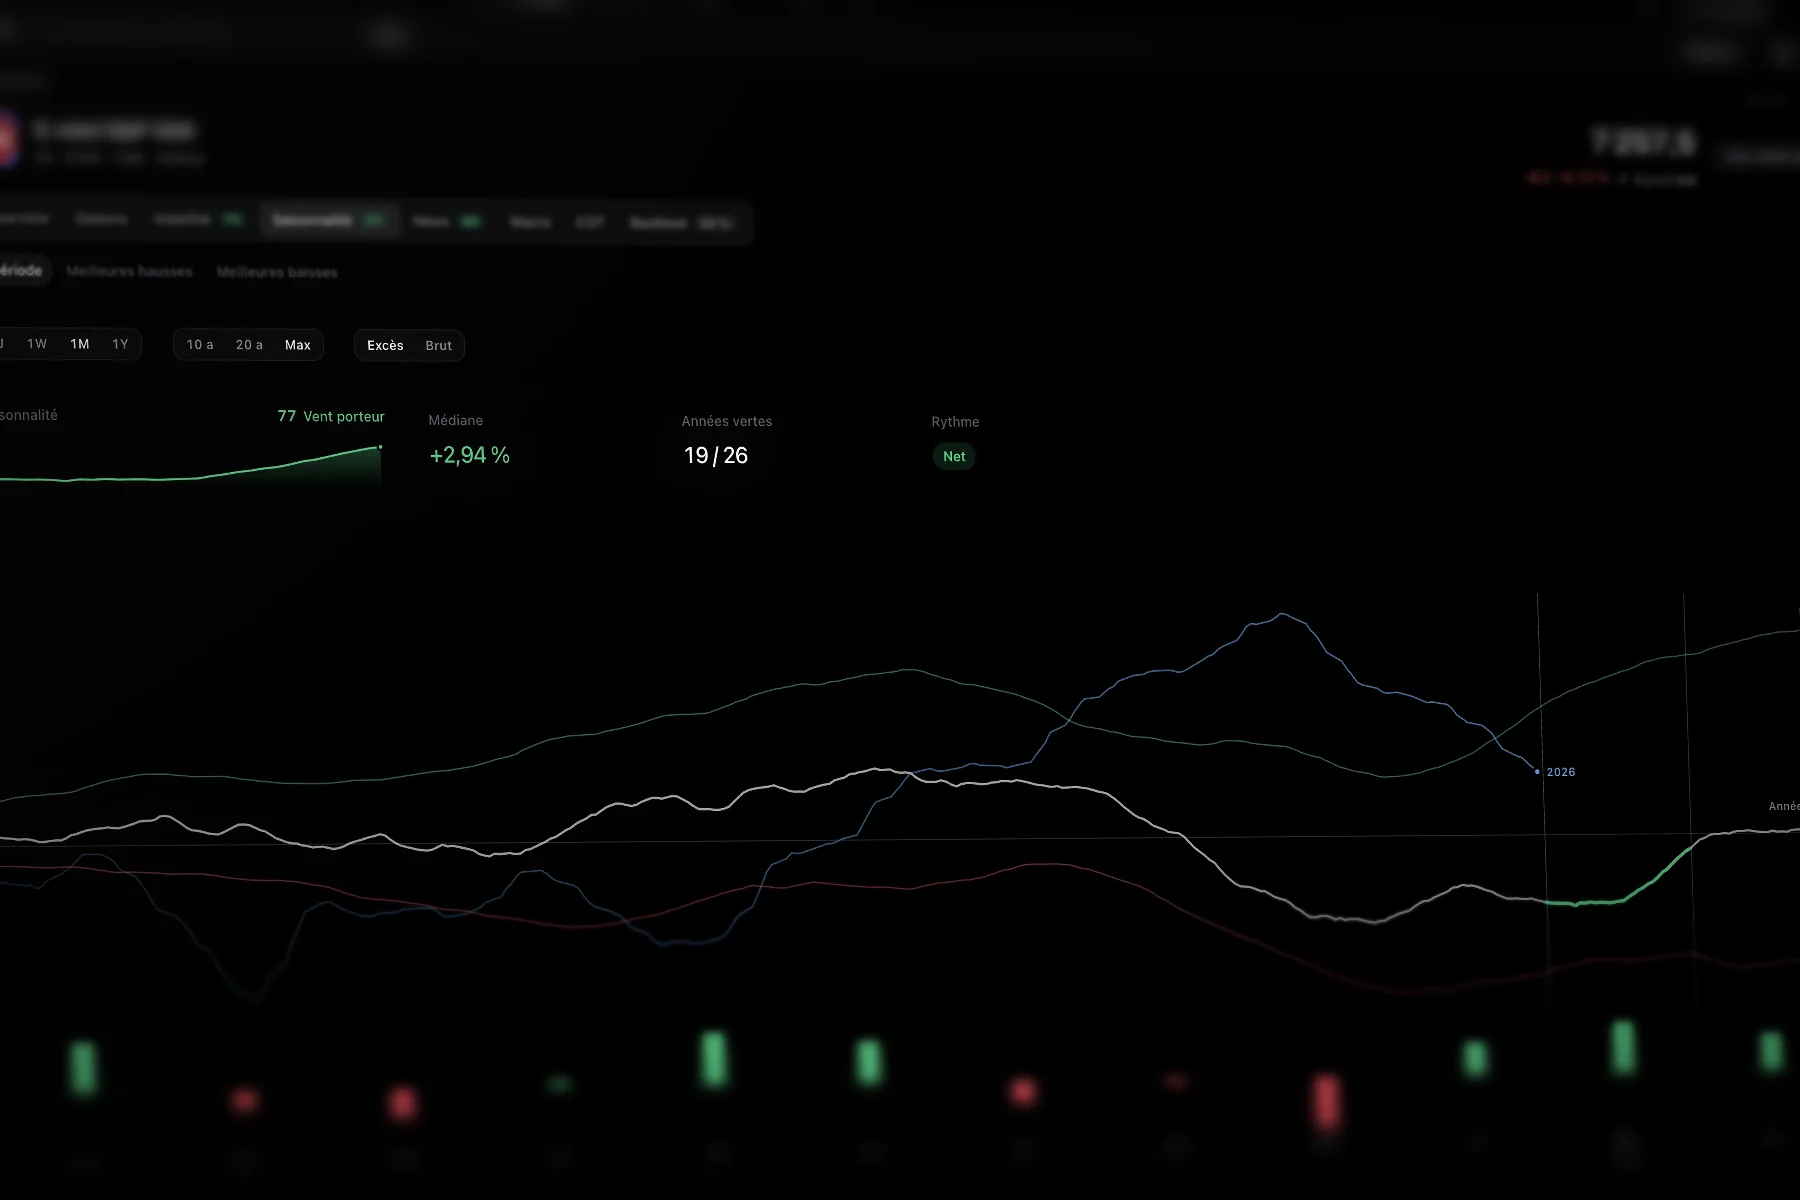
The median curve, the high, the low, the current year.
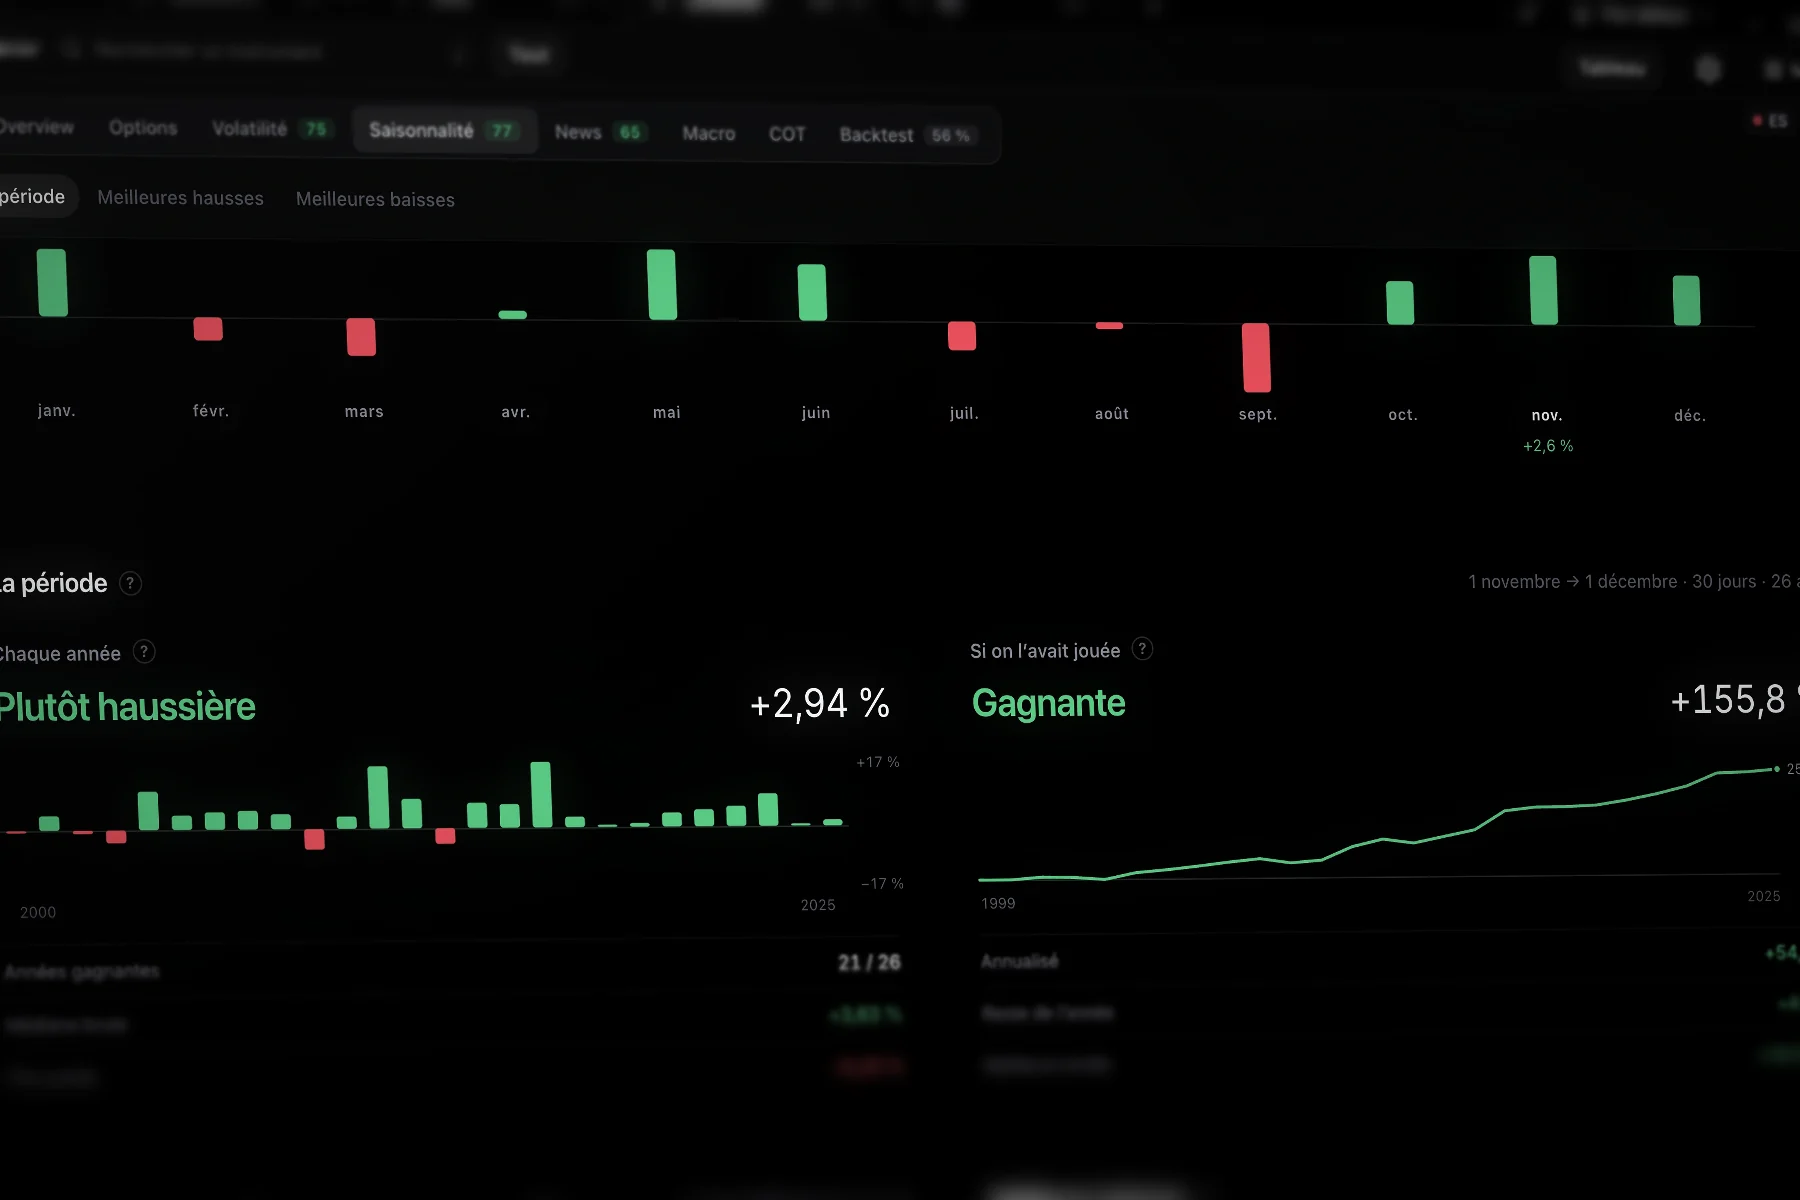
The period’s return, year after year.
The calendar moves markets too.
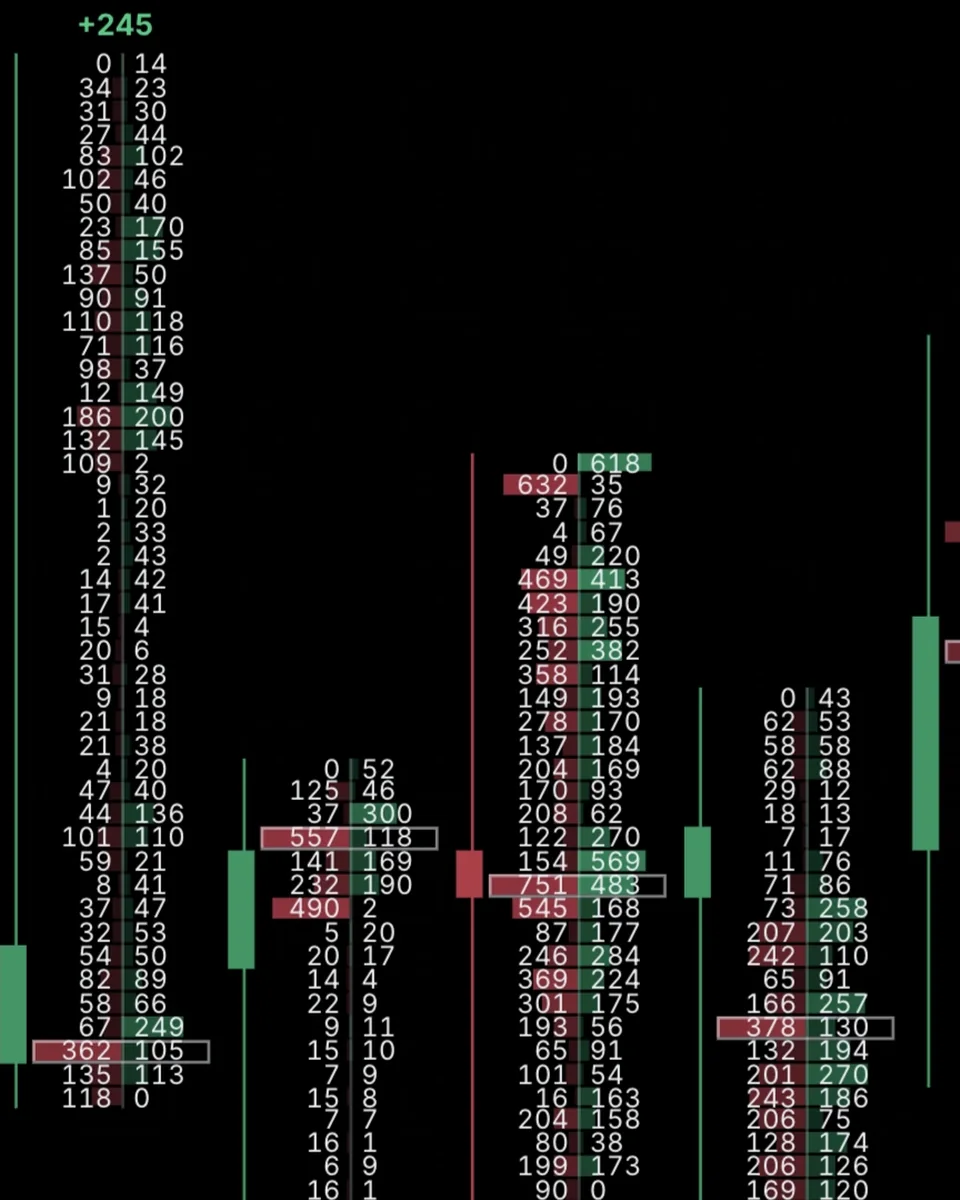 FootprintSee who’s hitting, price by price.
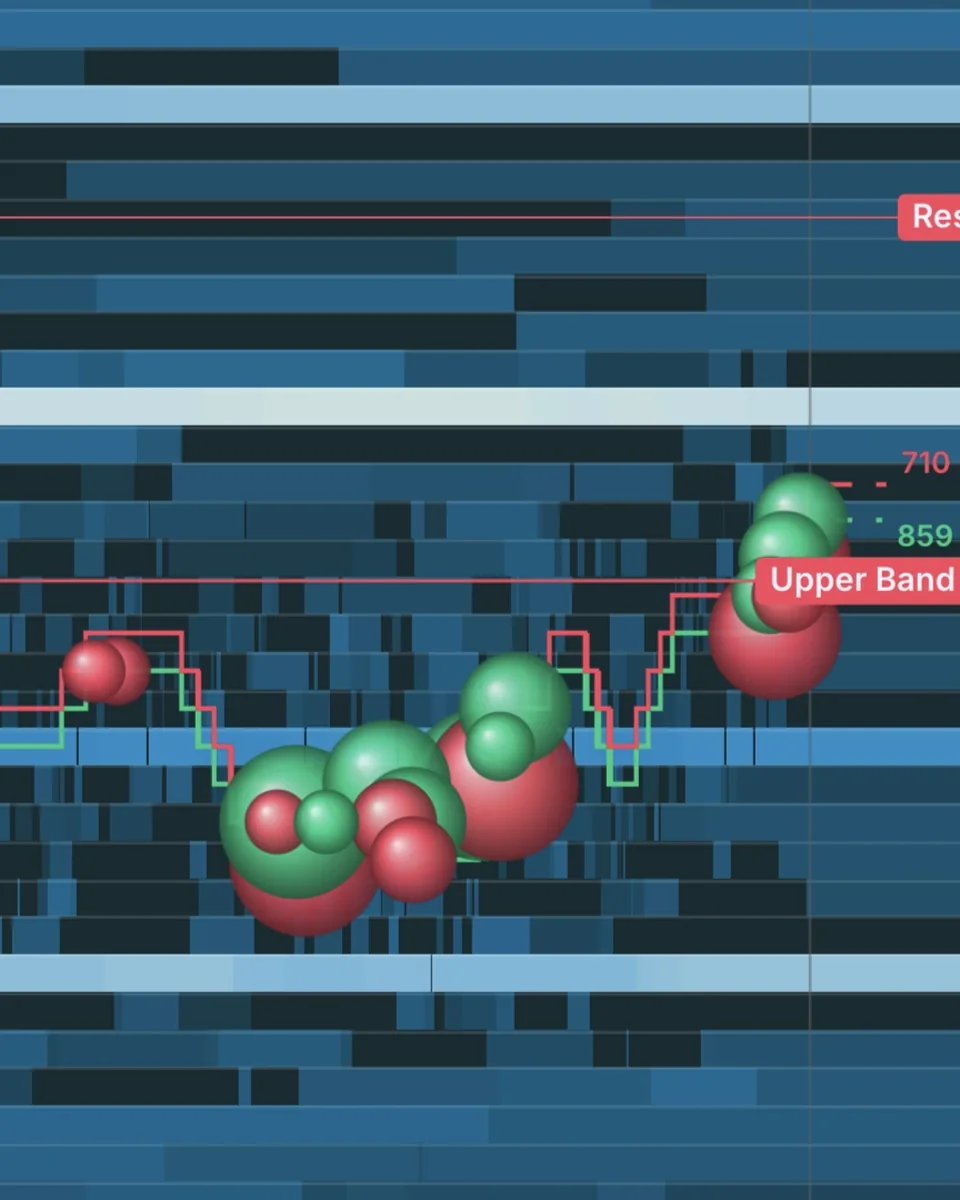 X-RayLiquidity, revealed.
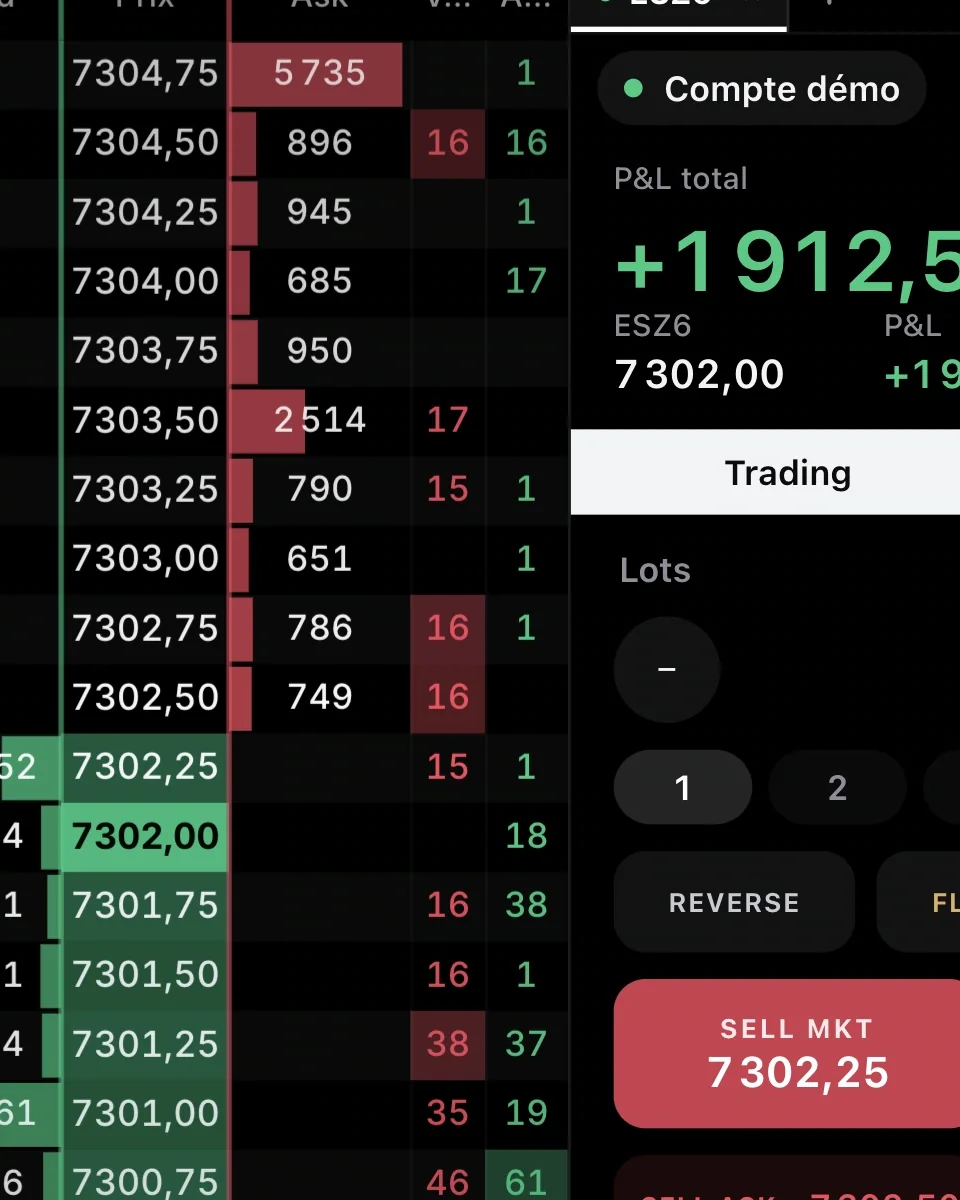 Order bookDepth, to the tick.
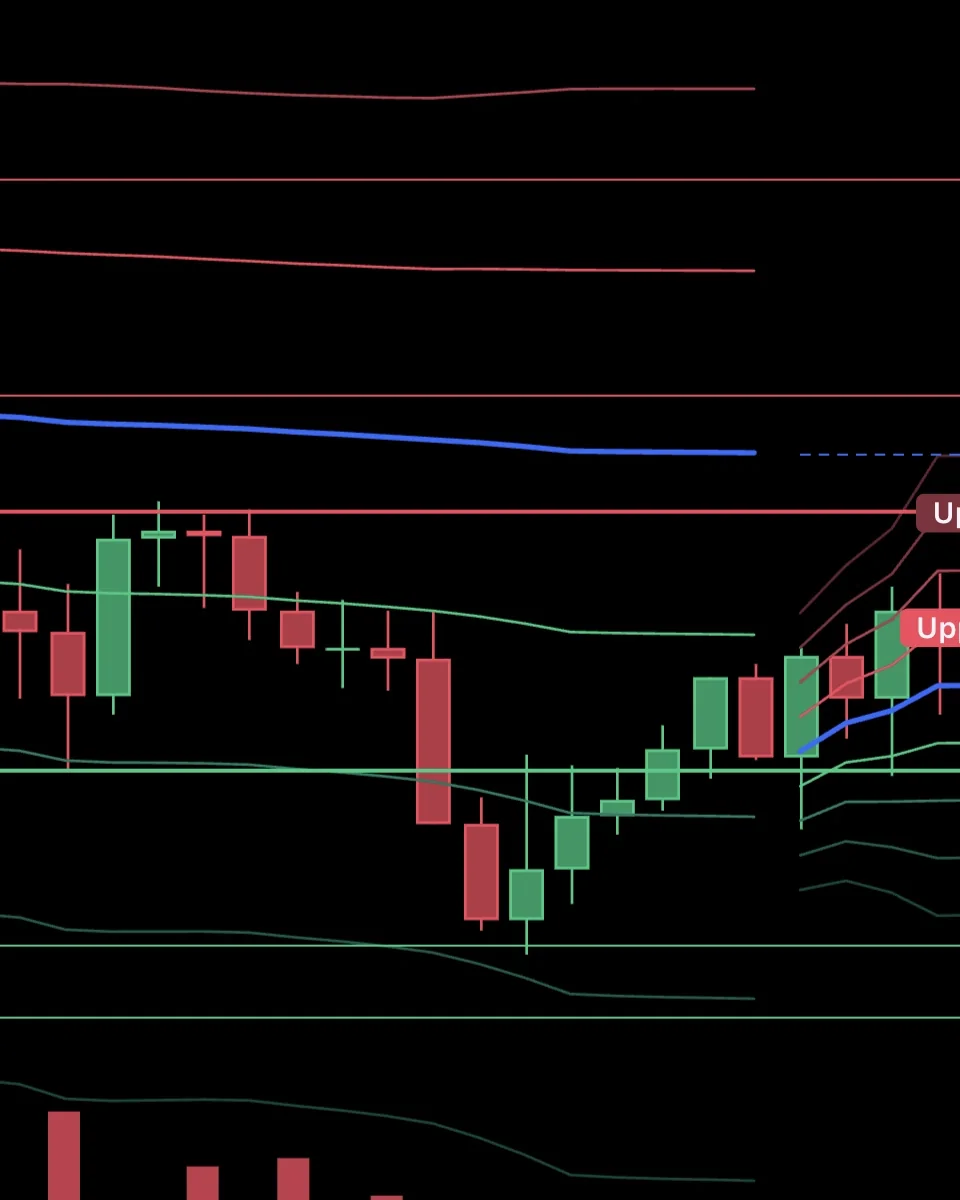 Indicators184 tools. Zero tinkering.
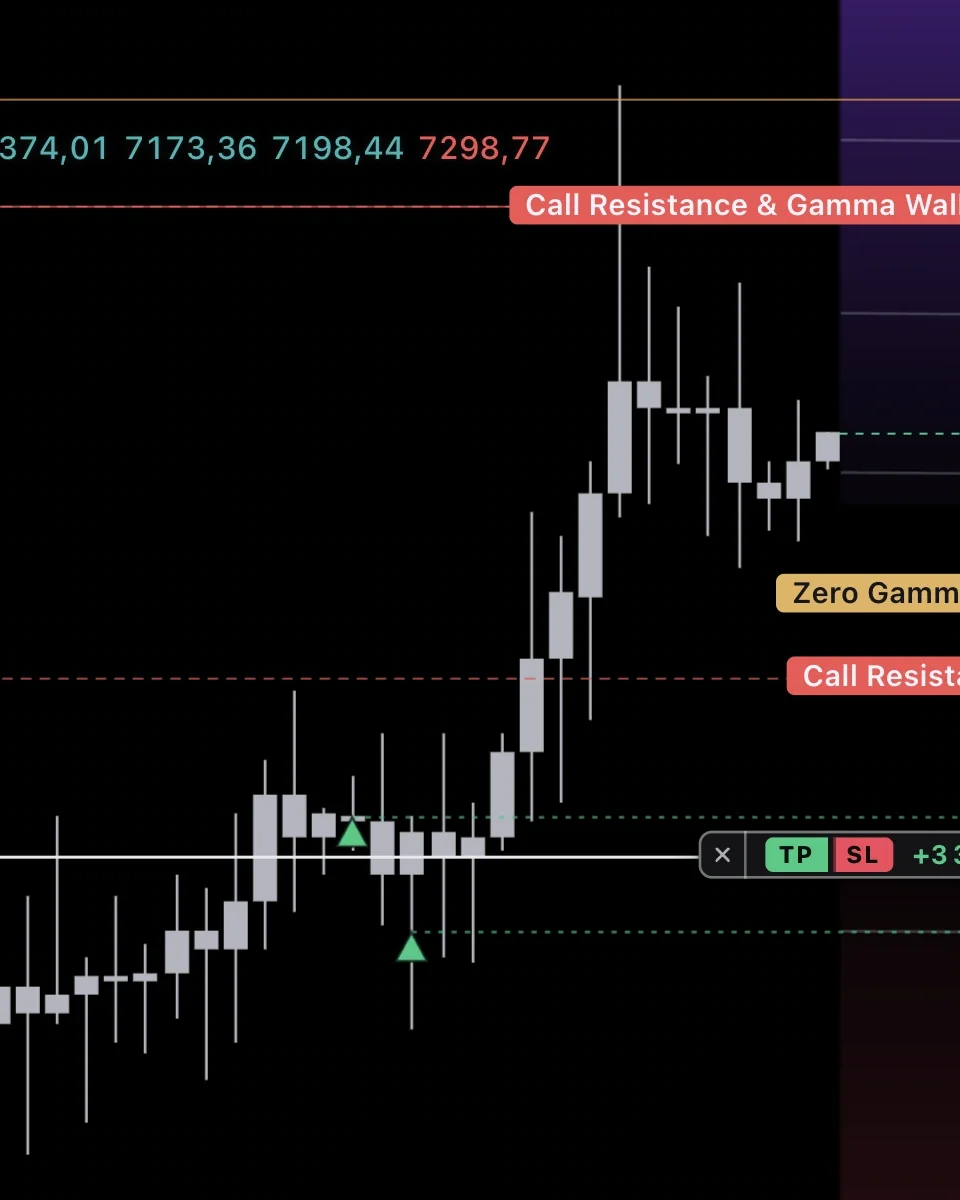 OptionsWhere the dealers hedge.
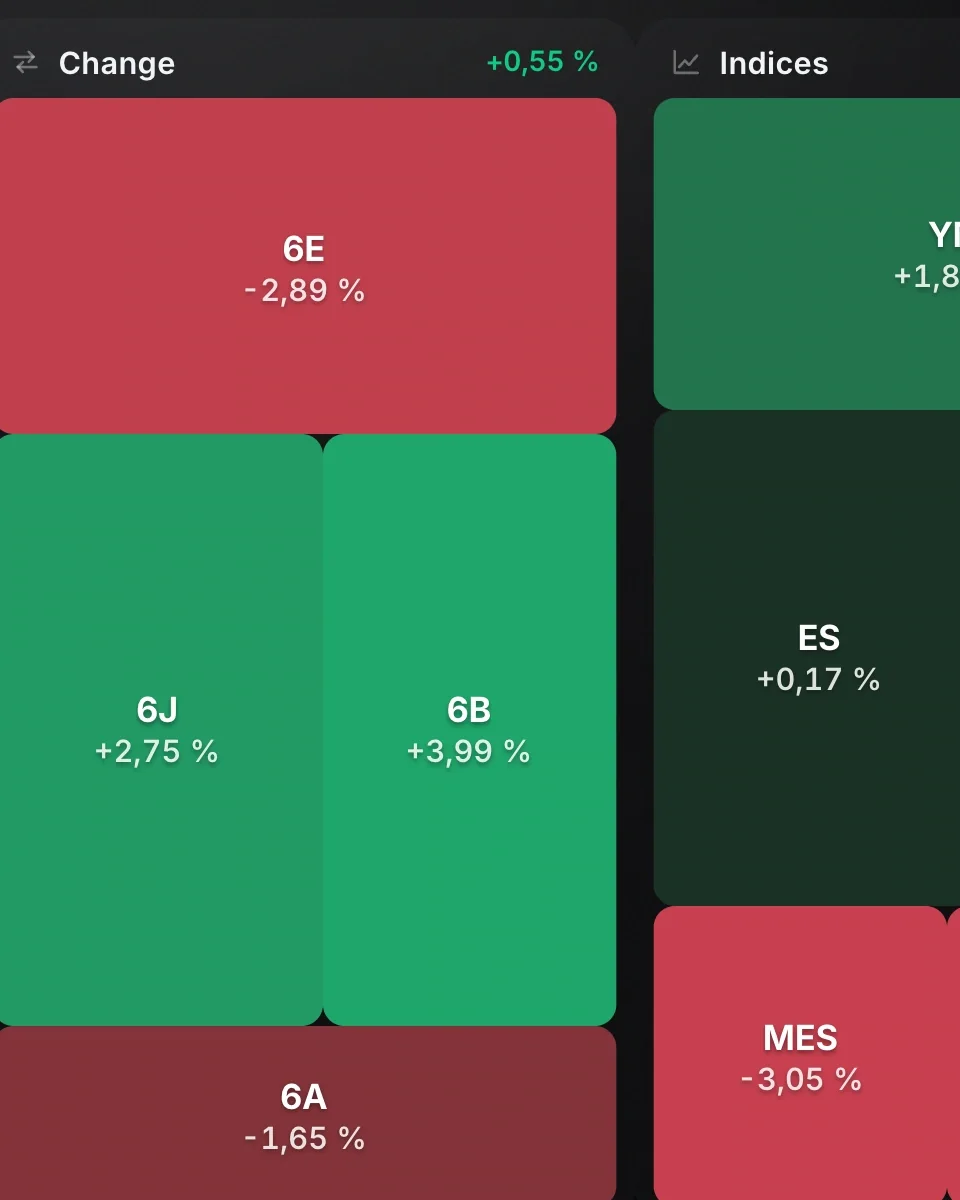 Screener and scoresEvery market, scored.
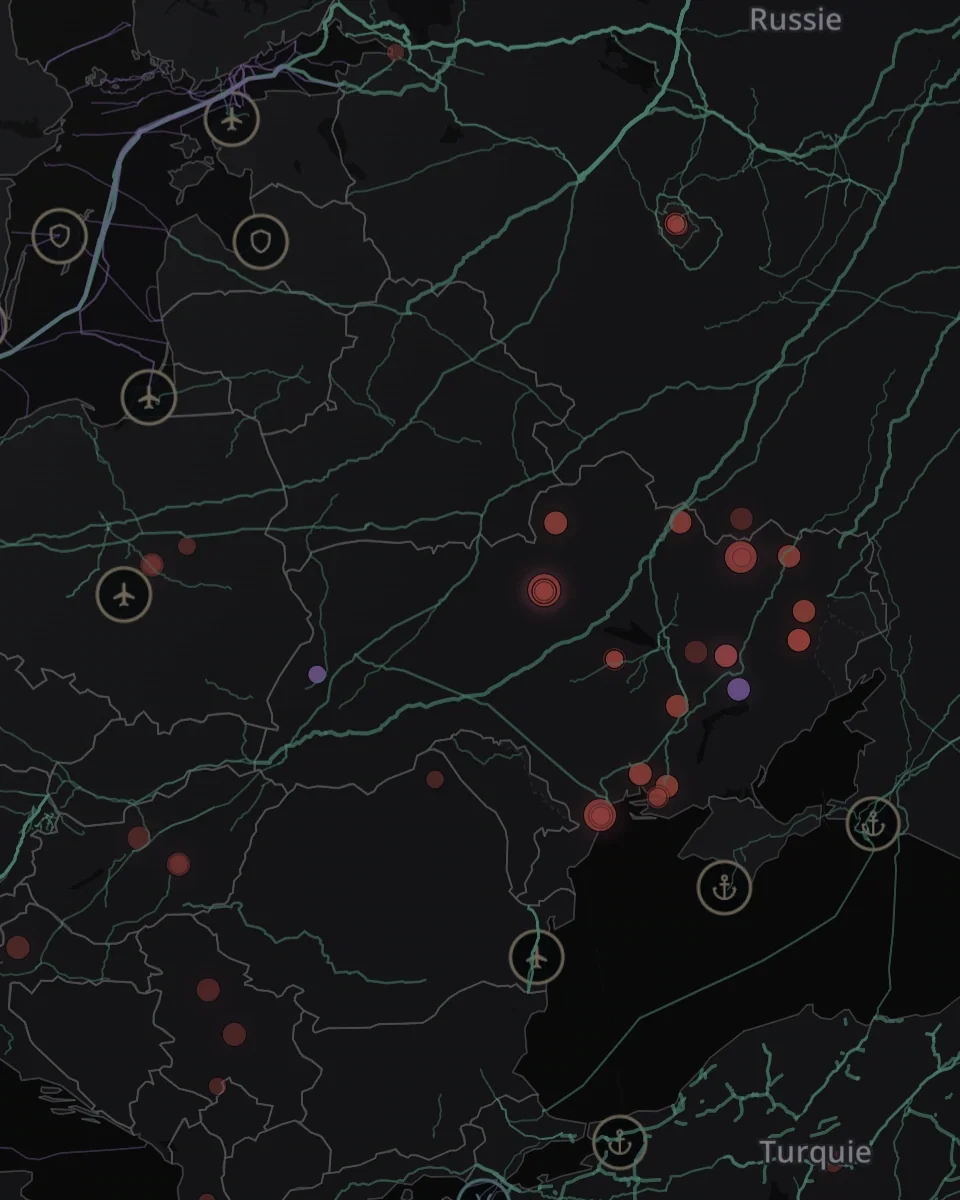 World MonitorThe whole world, live.
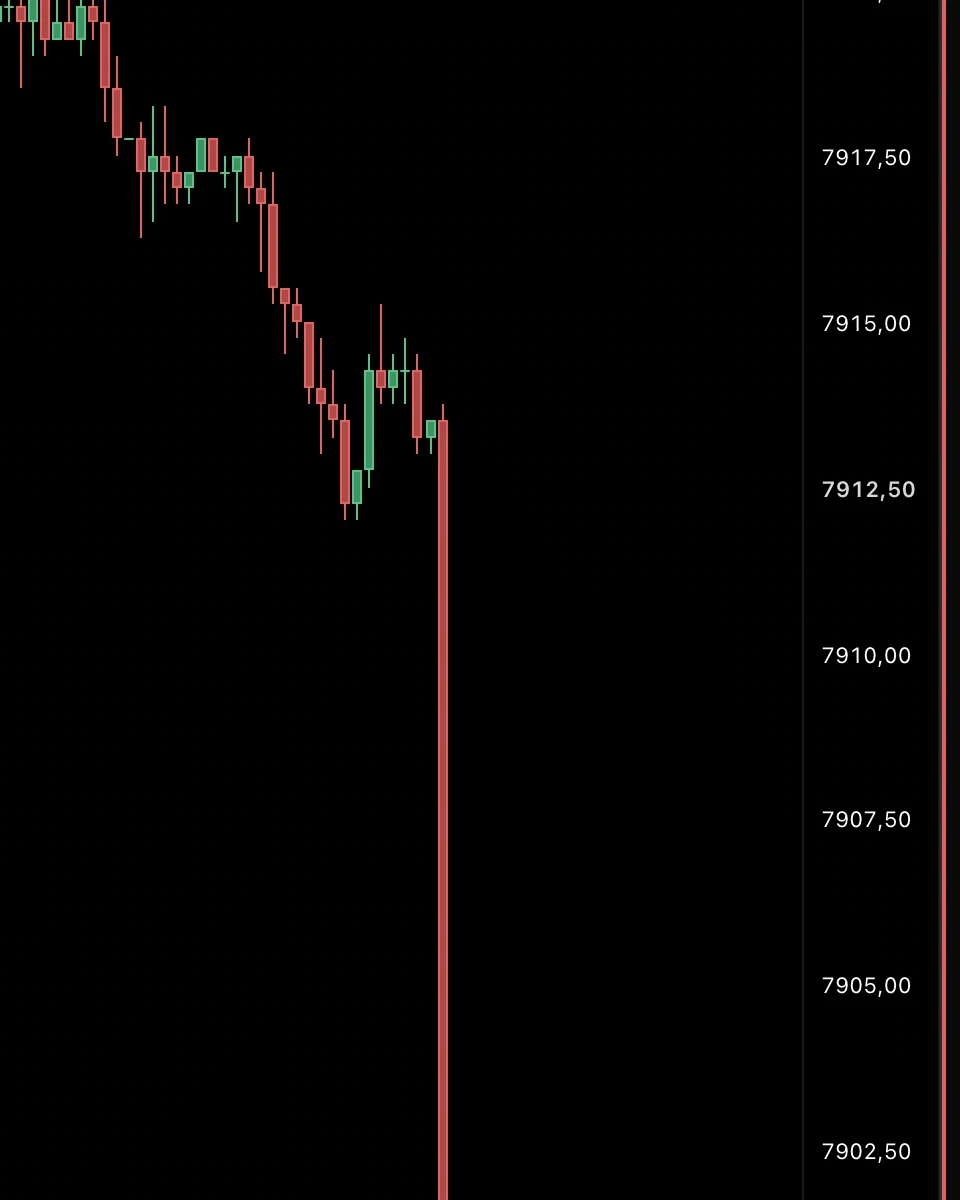 RadarEvery headline, its reaction.
 News and calendarEvery headline. Every release.
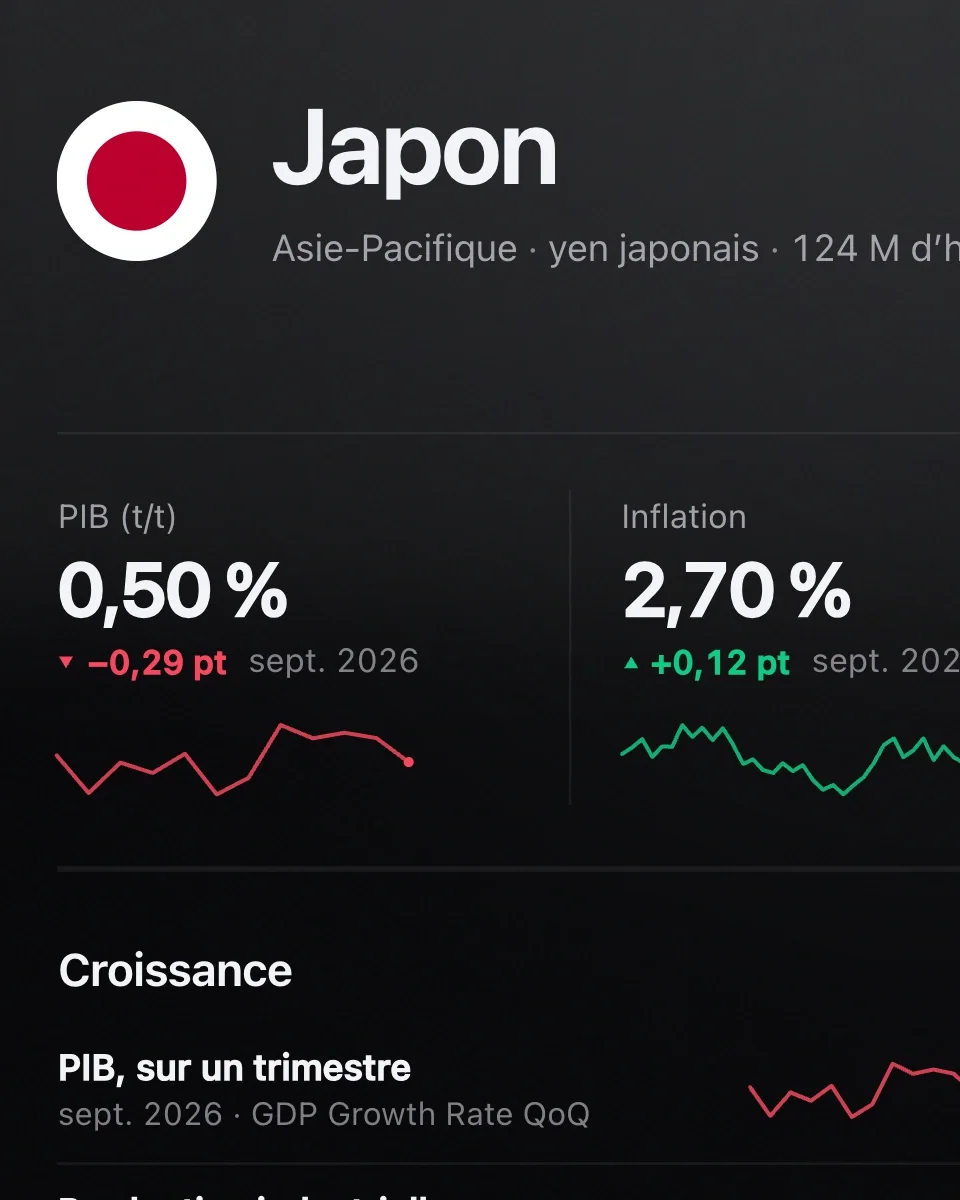 MacroEvery country, at a glance.
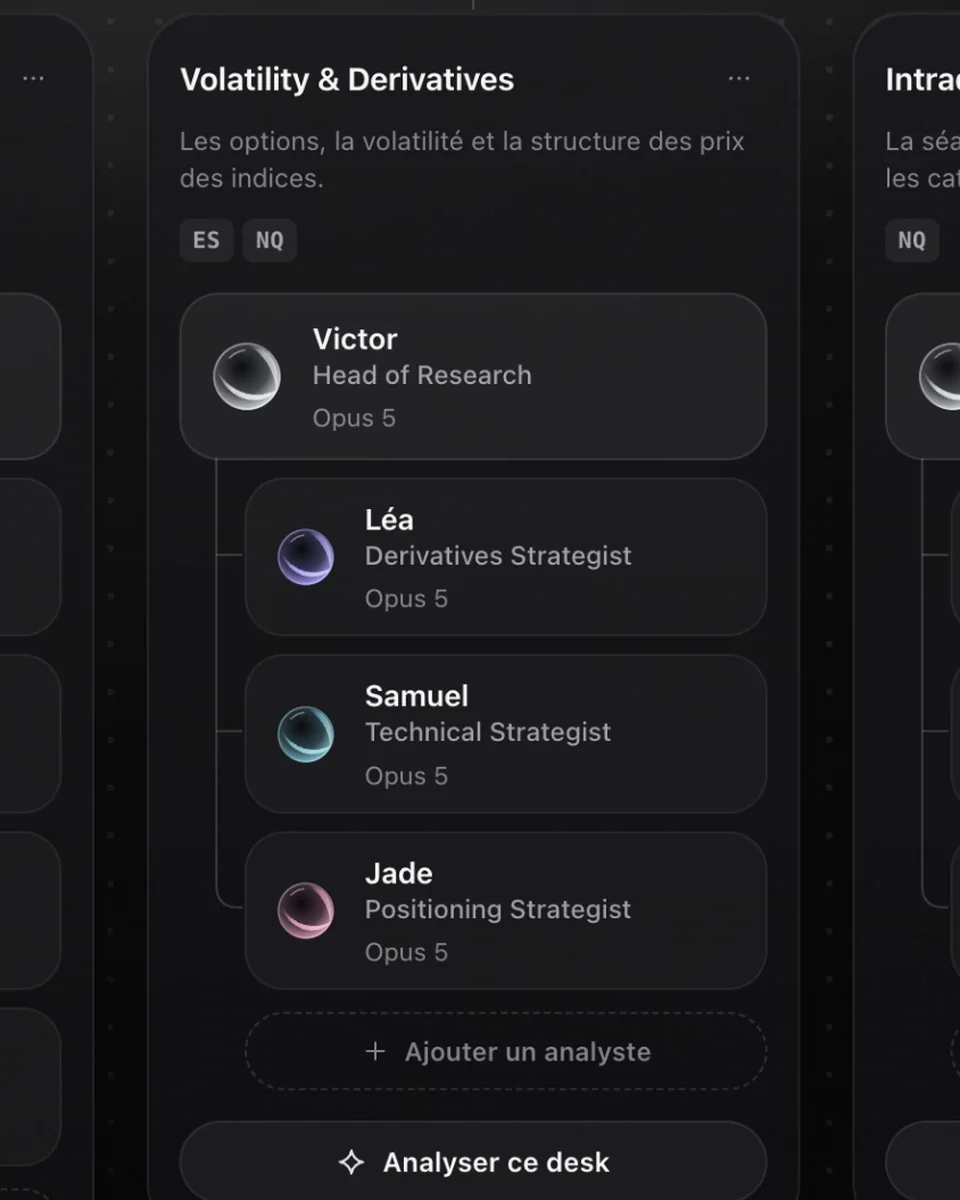 AI DeskYour fund. Your analysts.
Mac and Windows. Free to start, connected to your broker when you’re ready.
Start for free