
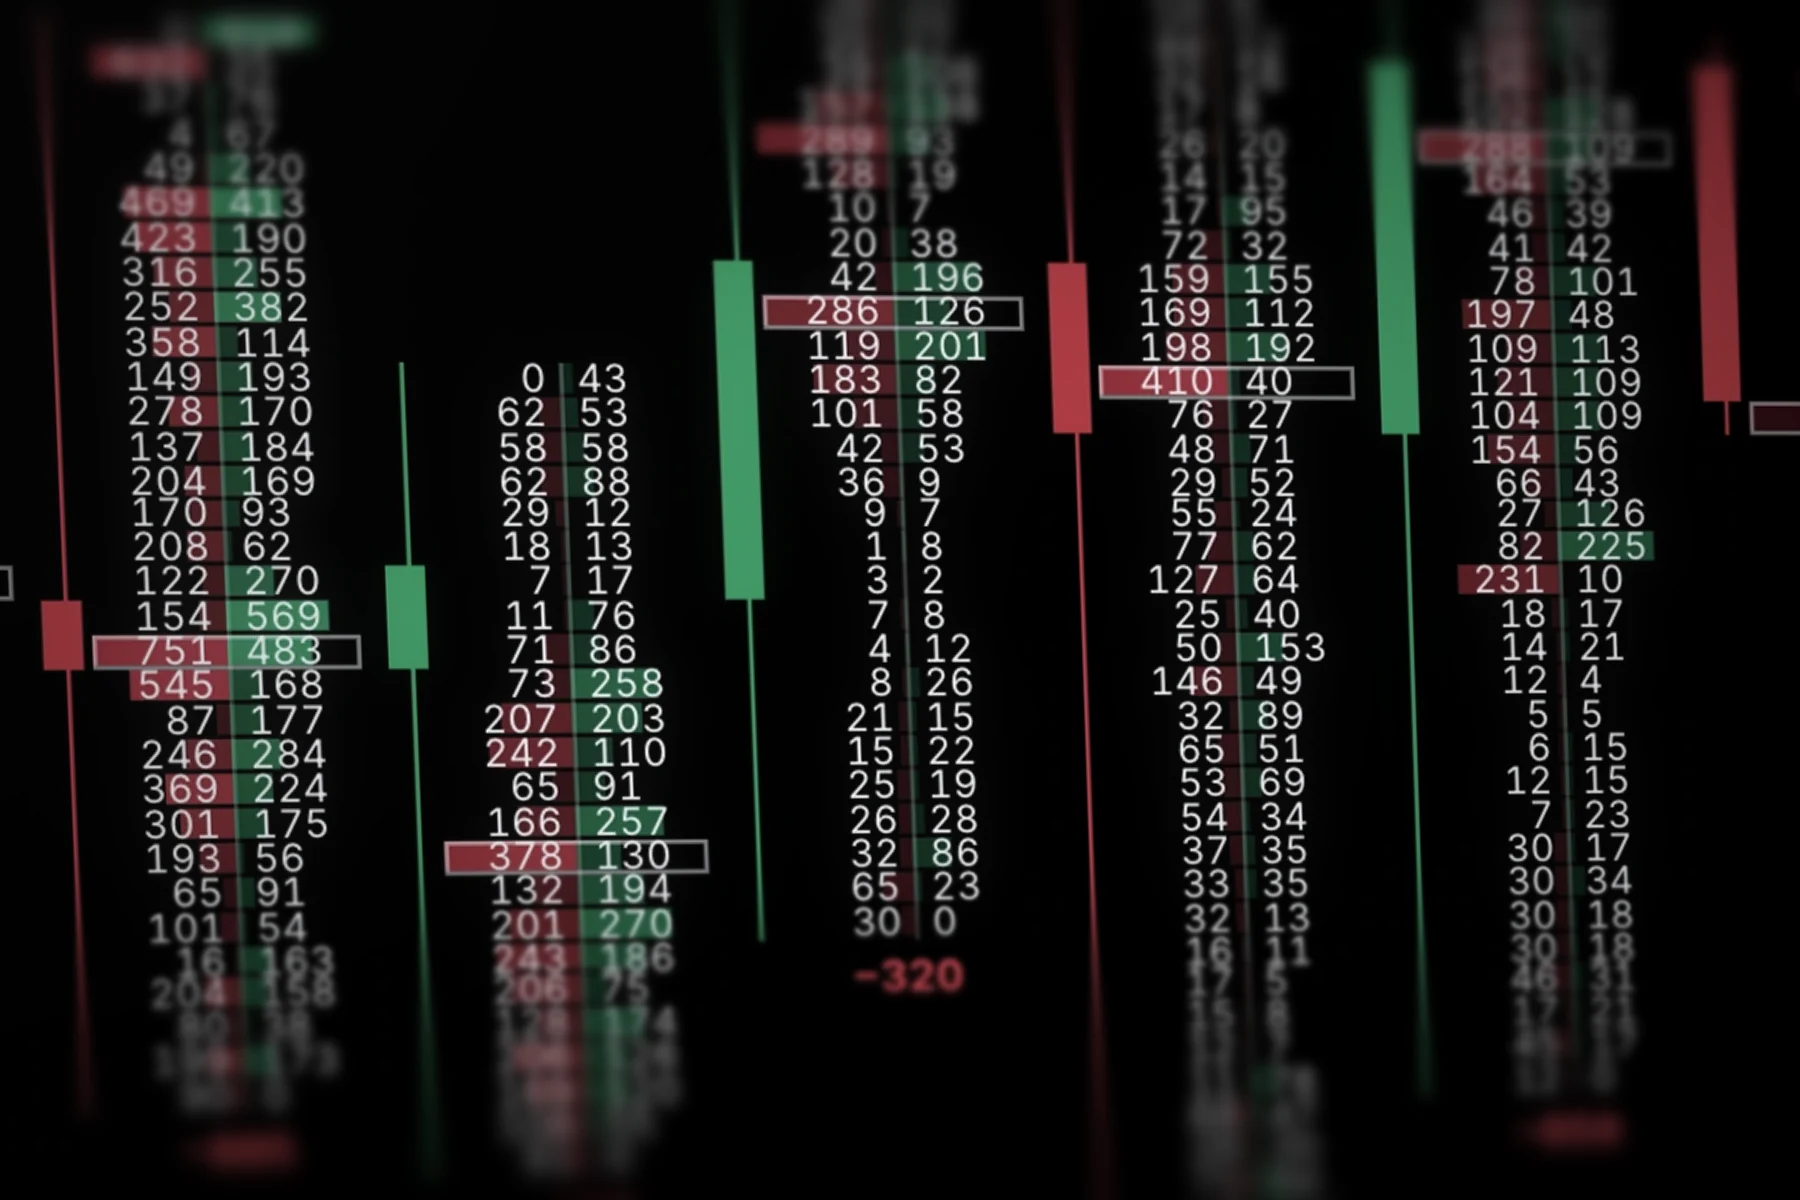
Imbalances, in color.
One side crushes the other: the cell lights up.
Every candle opened up: what’s bought at the ask, what’s sold at the bid, at every price. Tick by tick, on your broker’s data.
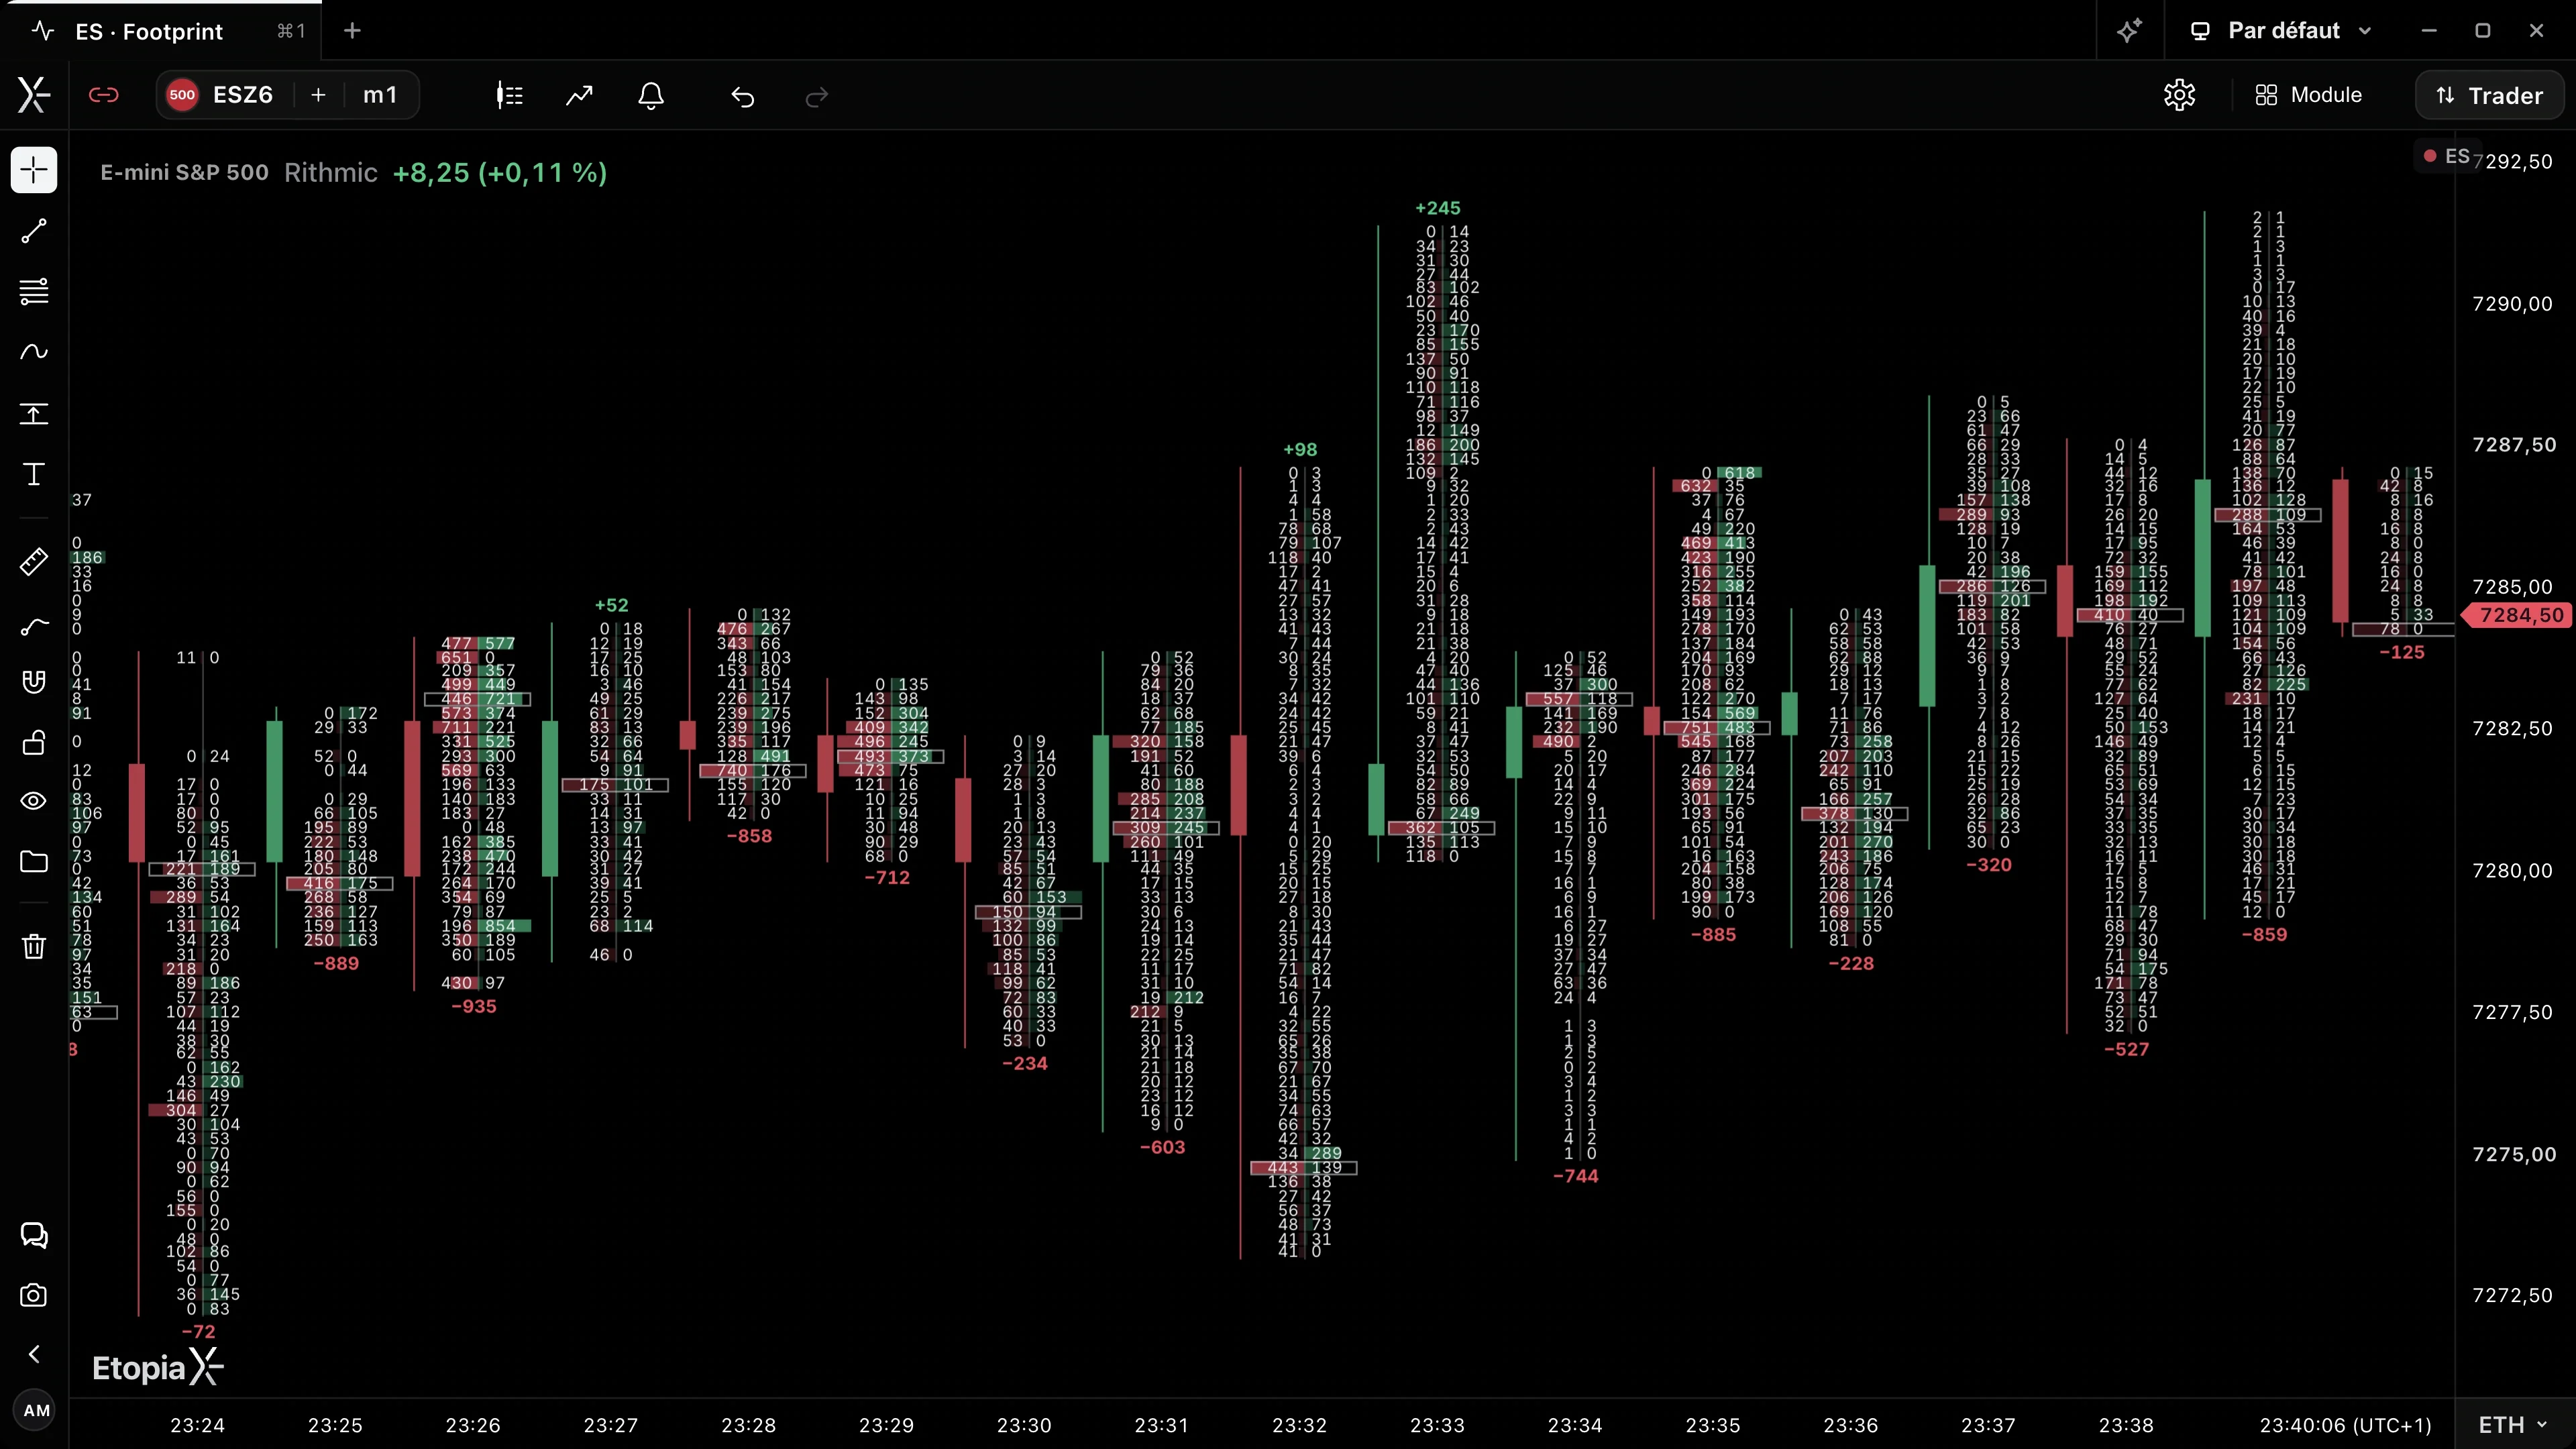
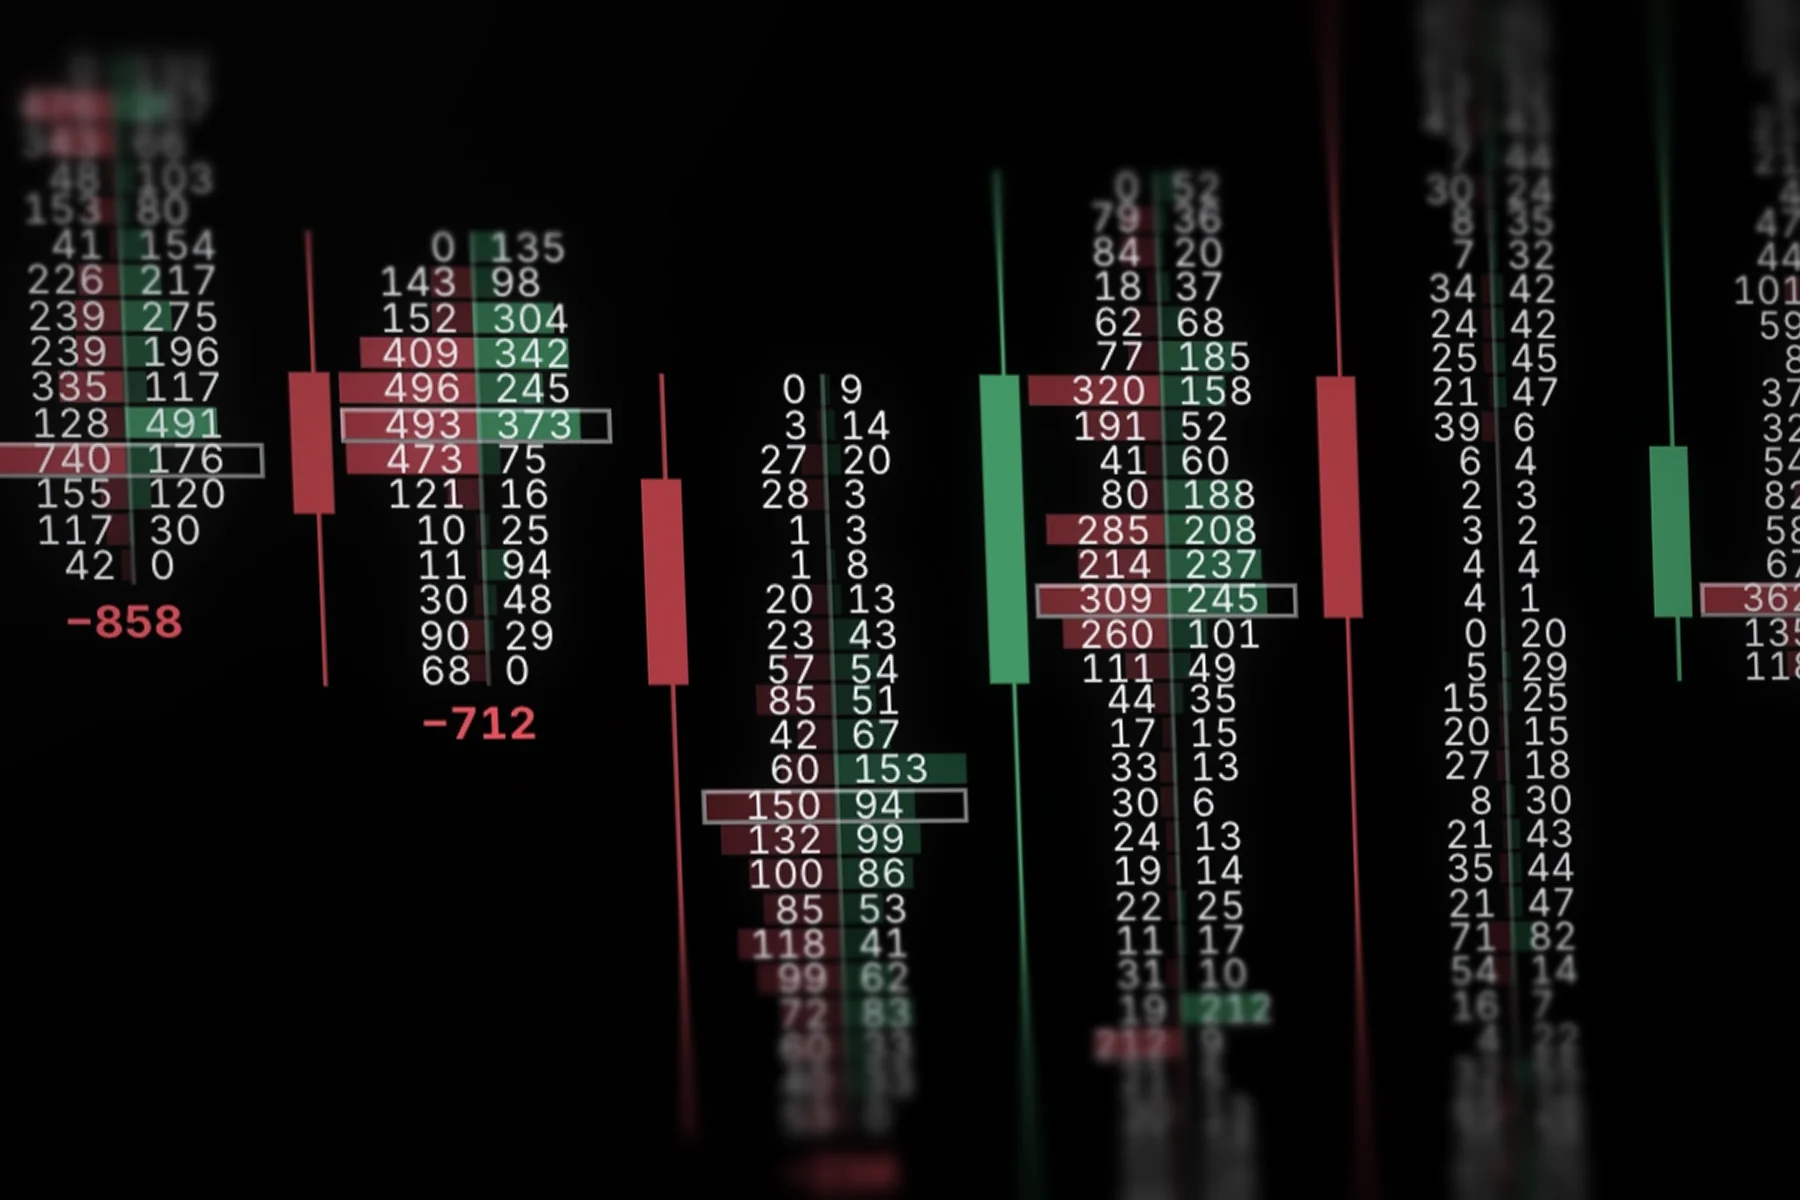
Market sells on the left, market buys on the right.
When one side crushes the other, the cell shows it.
The most traded price of every candle.
Buyers minus sellers, in one number.
Every cell tells a battle.
One side crushes the other: the cell lights up.
Buyers minus sellers, under every candle.
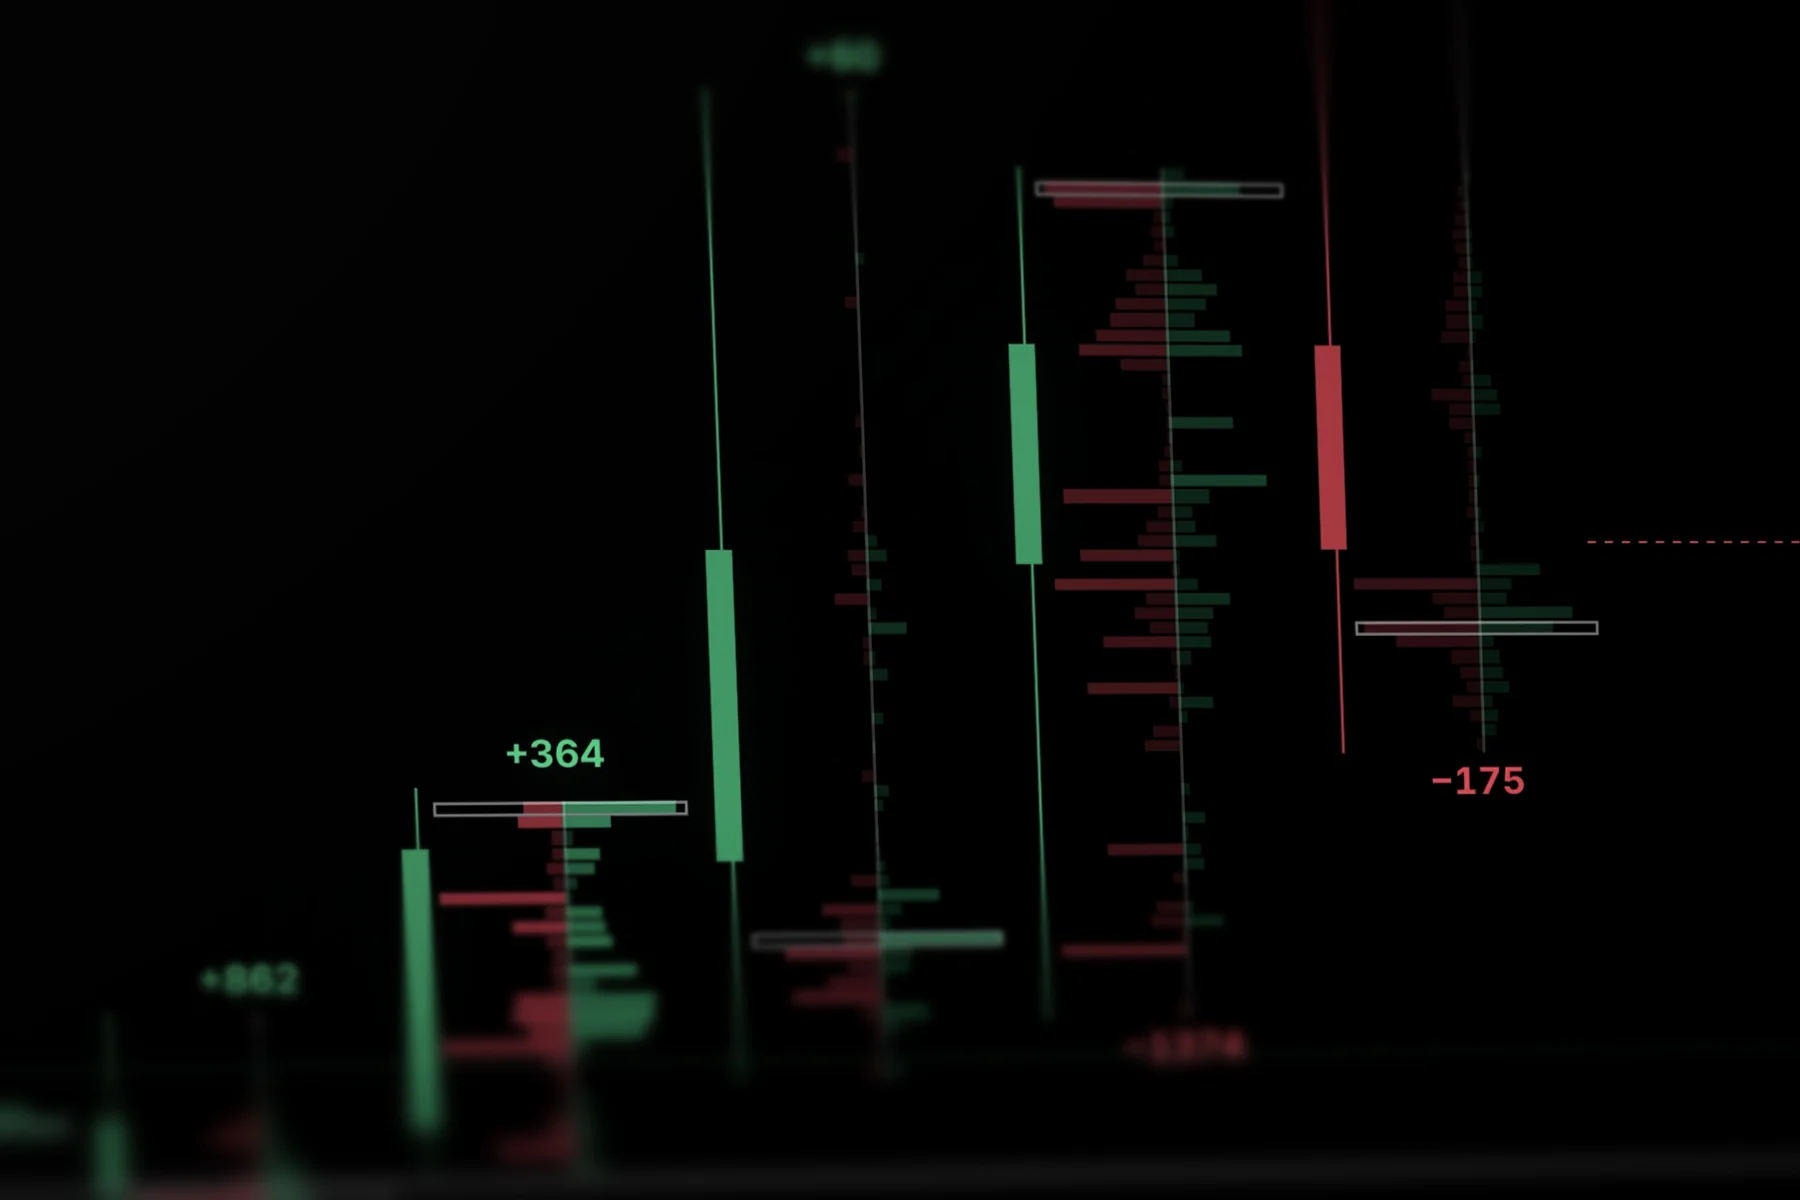
When price runs, the histogram takes over.
Price tells you where. The footprint tells you who.
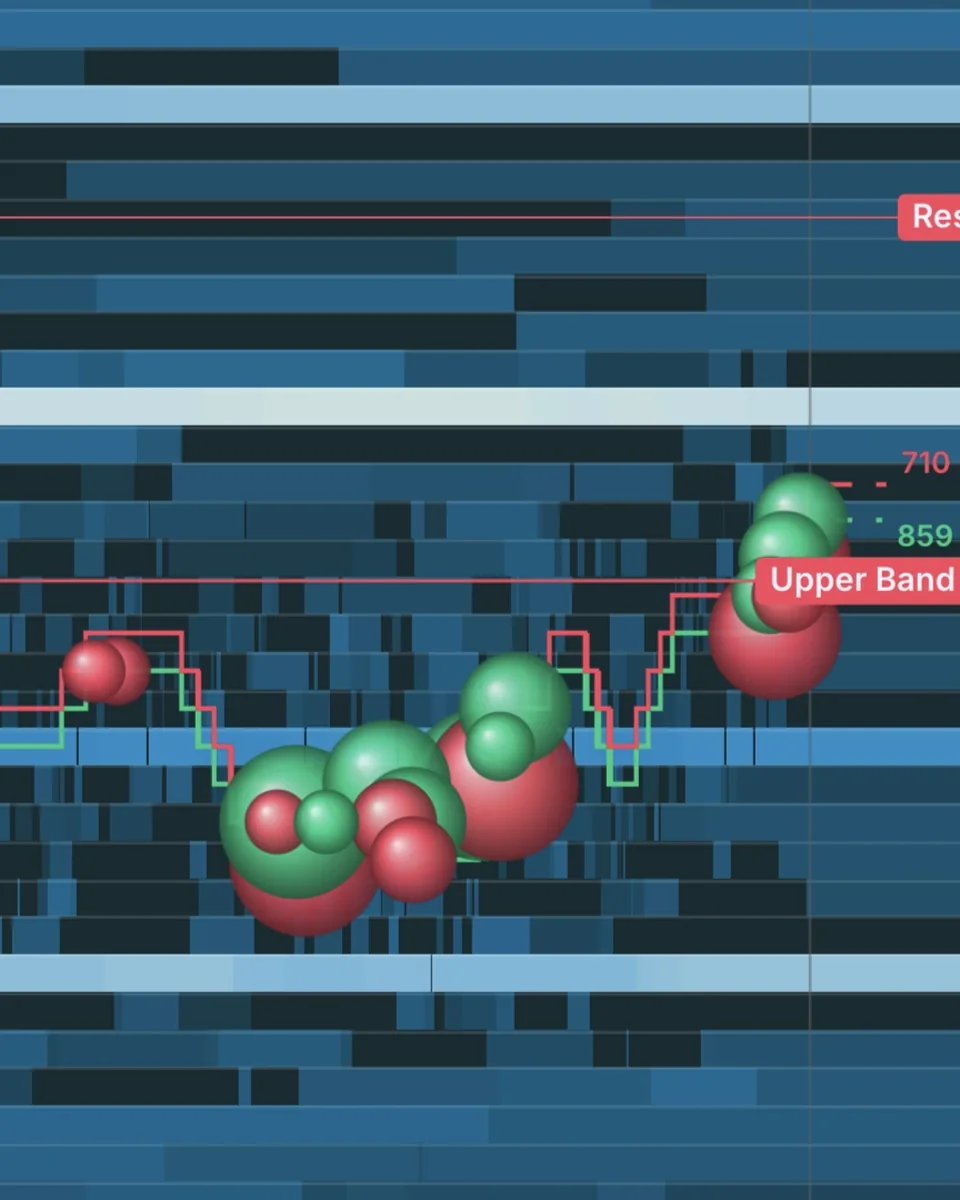 X-RayLiquidity, revealed.
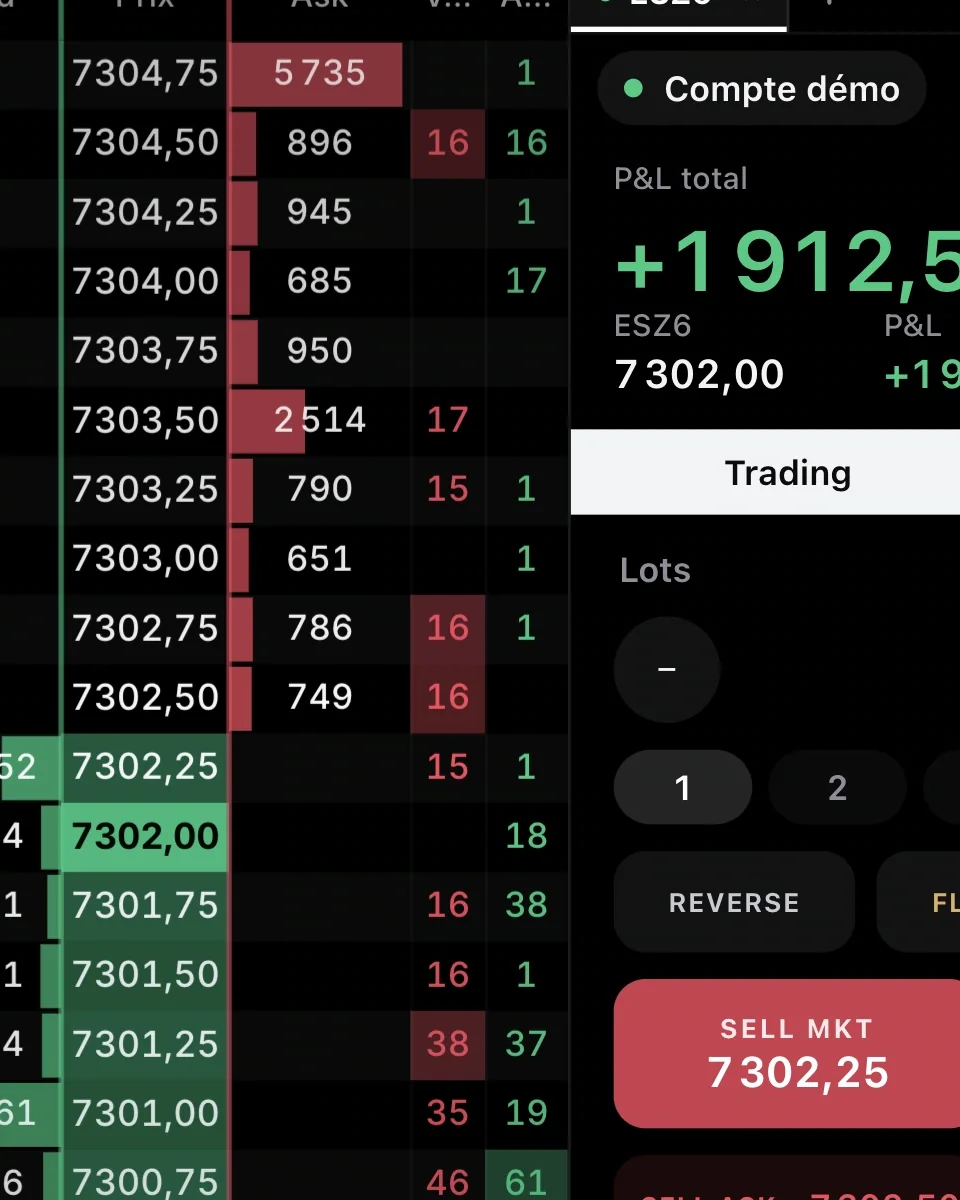 Order bookDepth, to the tick.
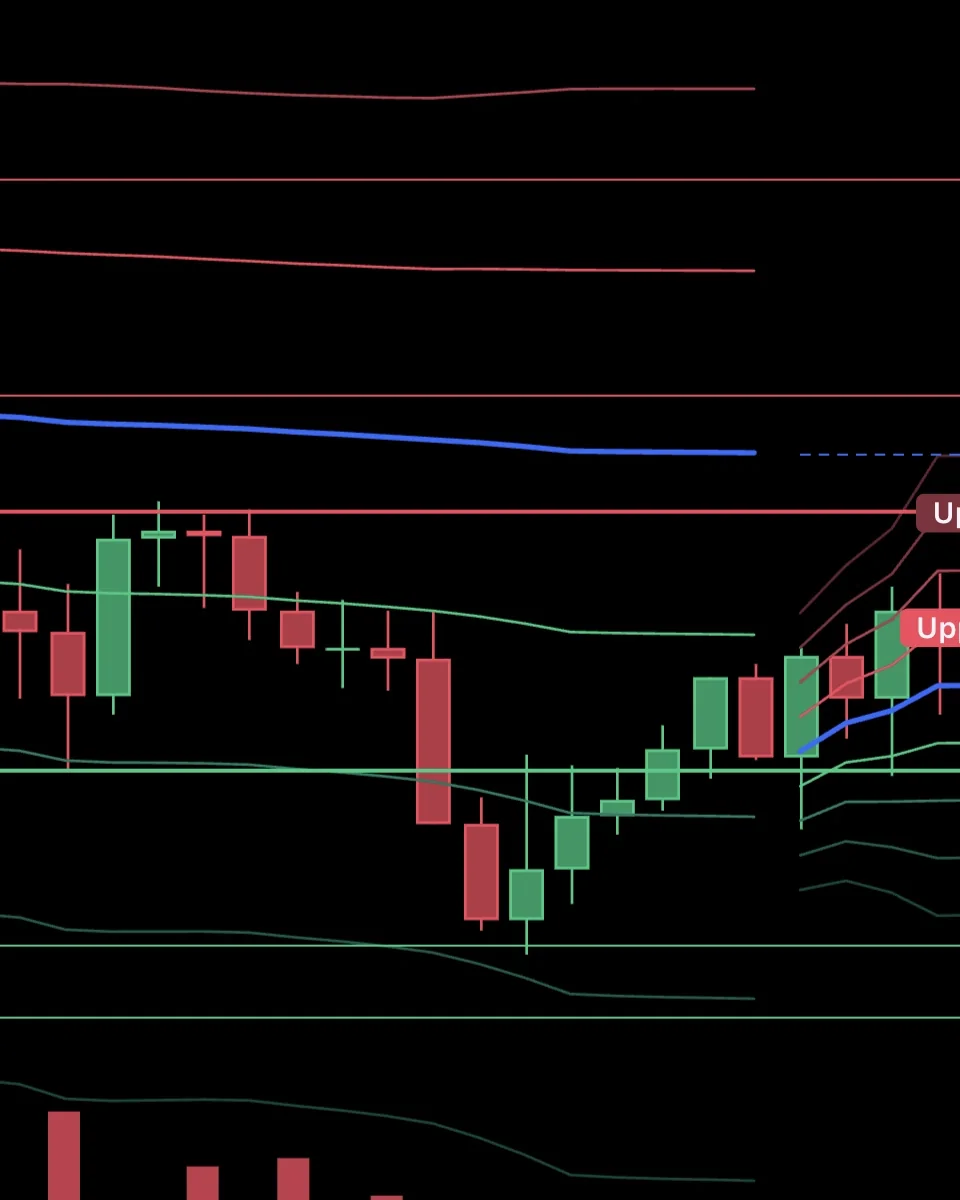 Indicators184 tools. Zero tinkering.
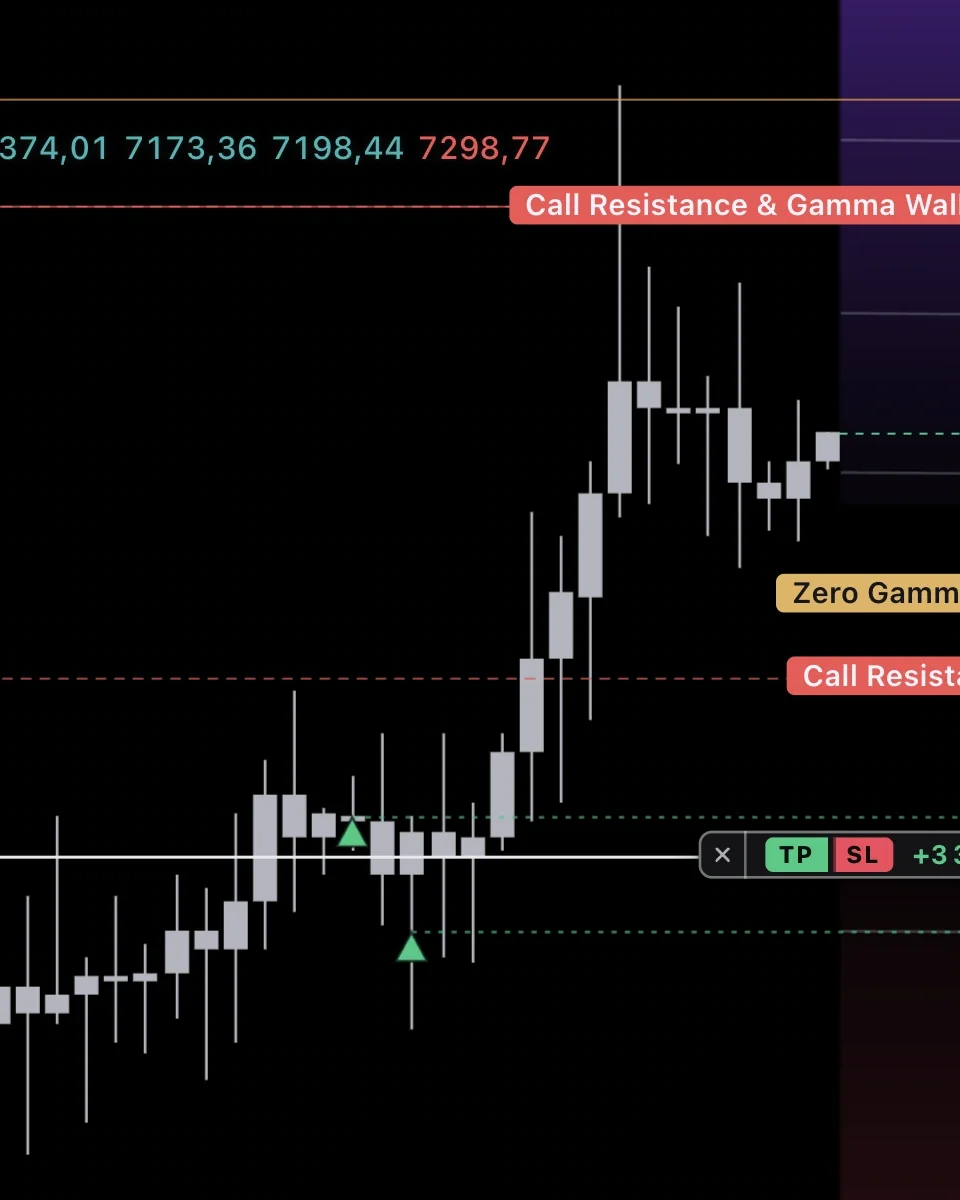 OptionsWhere the dealers hedge.
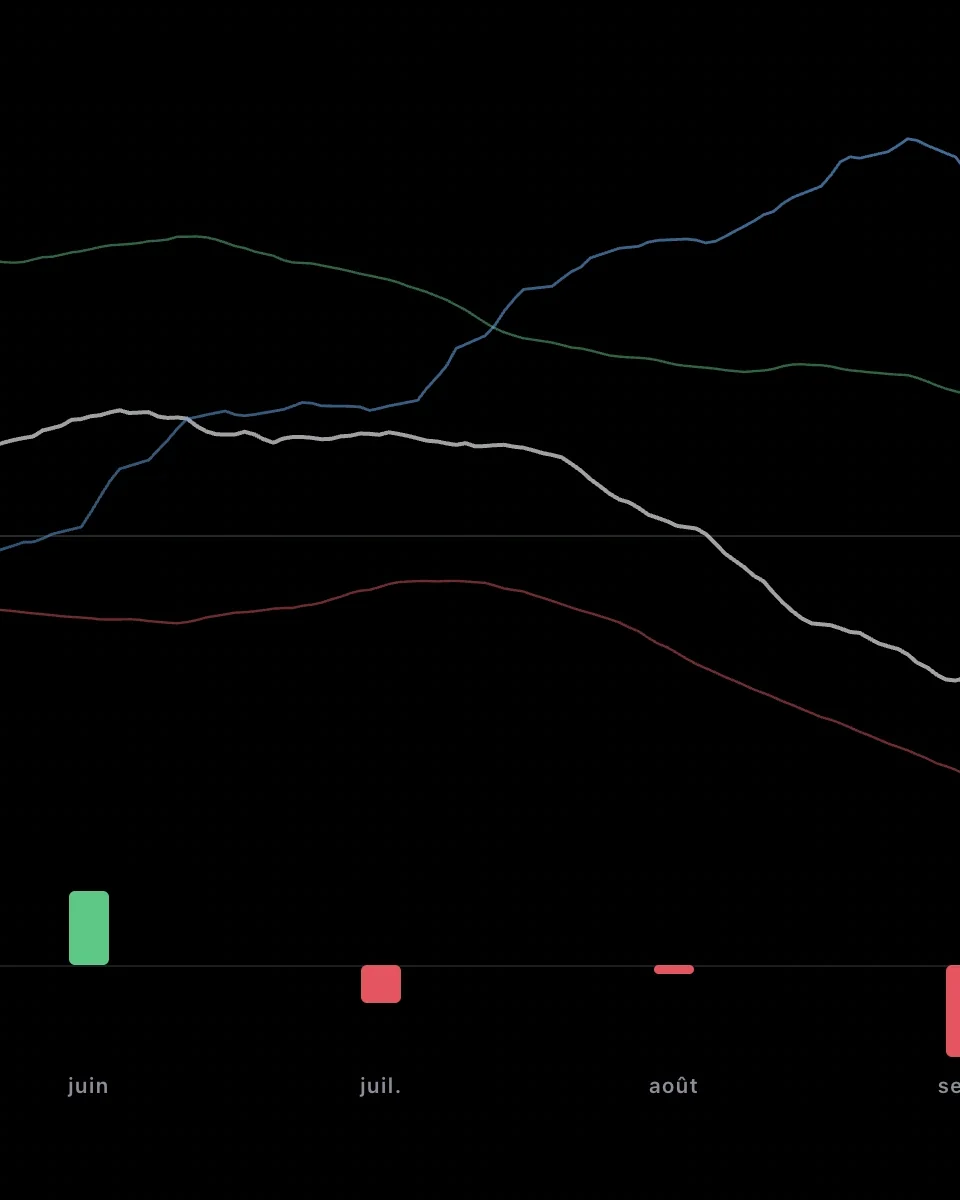 SeasonalityMarkets have seasons.
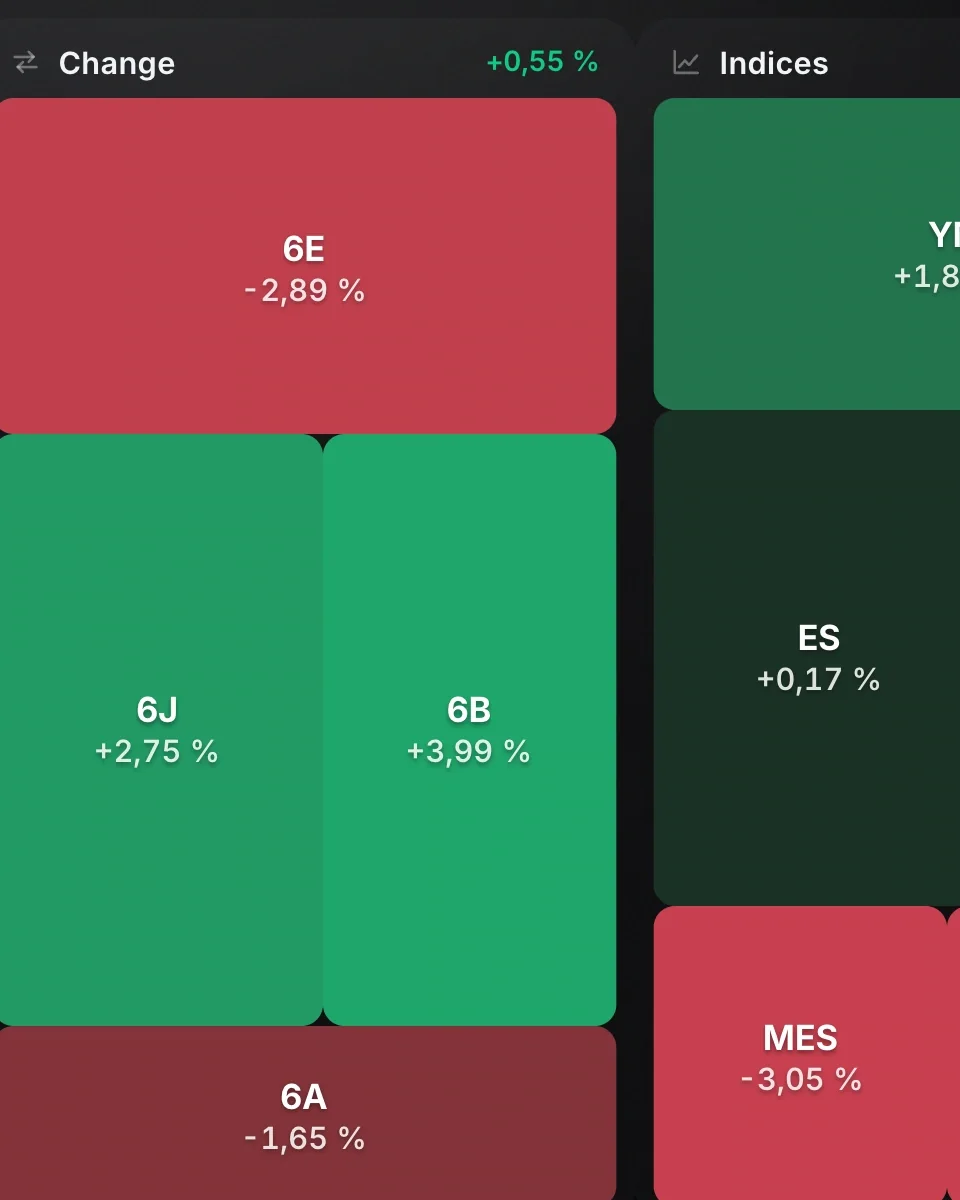 Screener and scoresEvery market, scored.
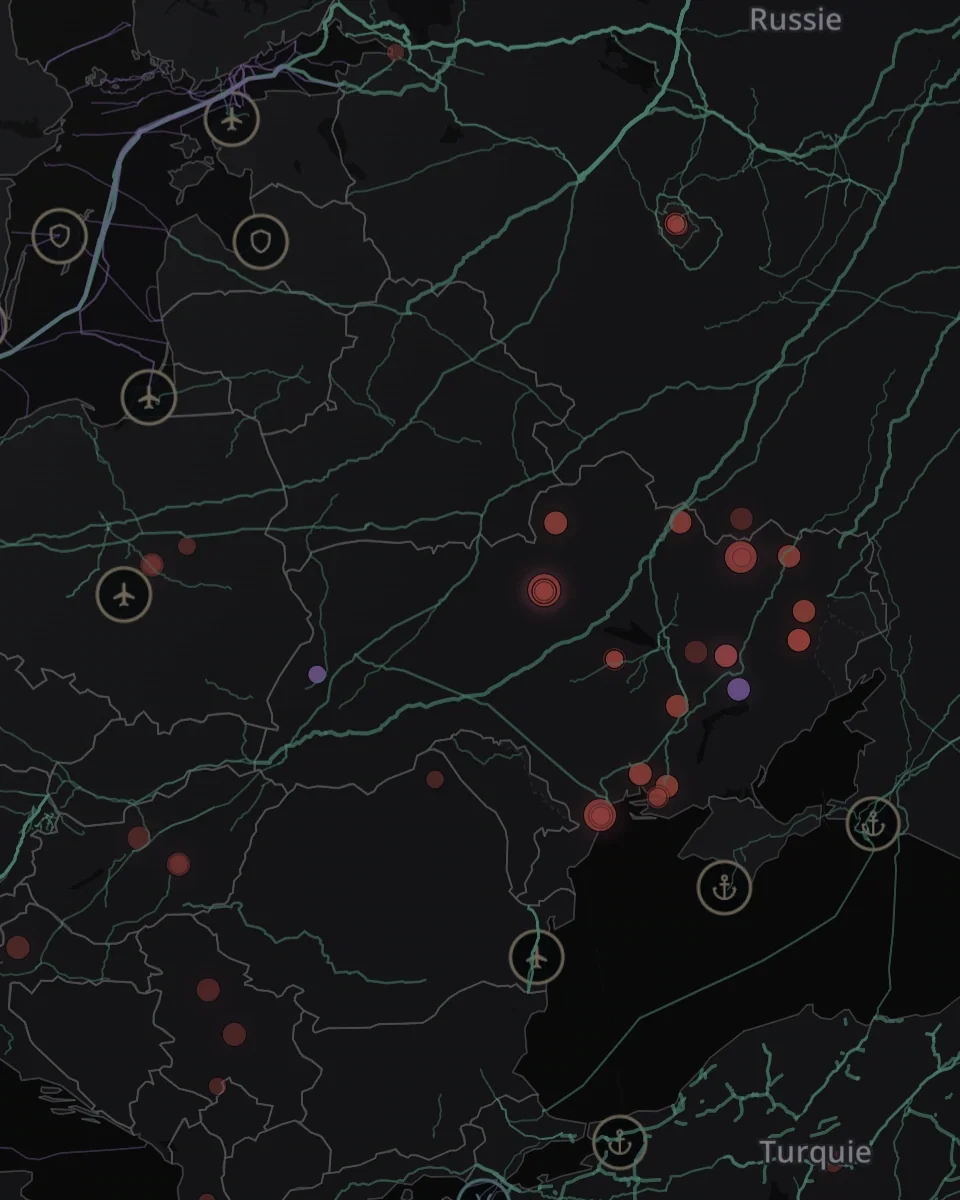 World MonitorThe whole world, live.
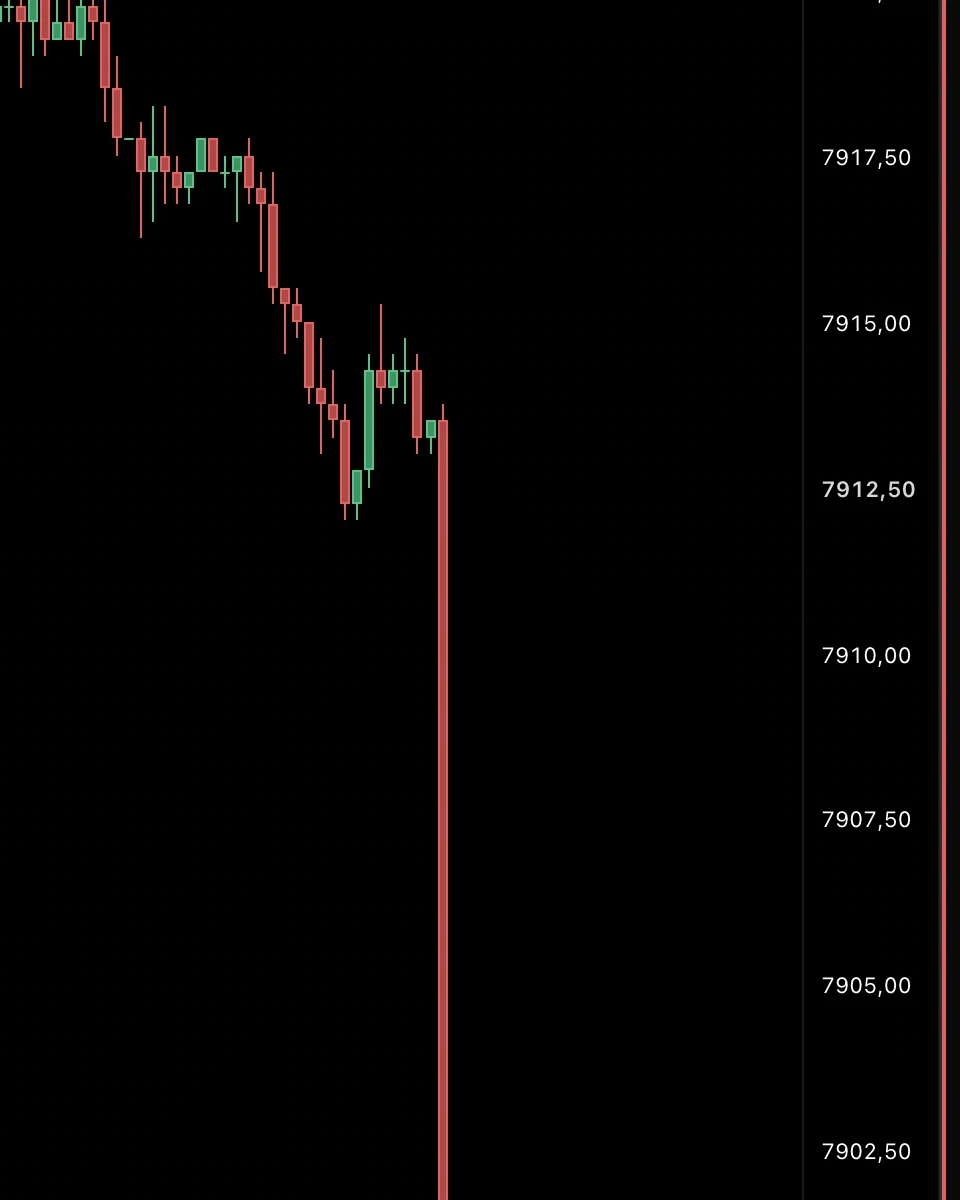 RadarEvery headline, its reaction.
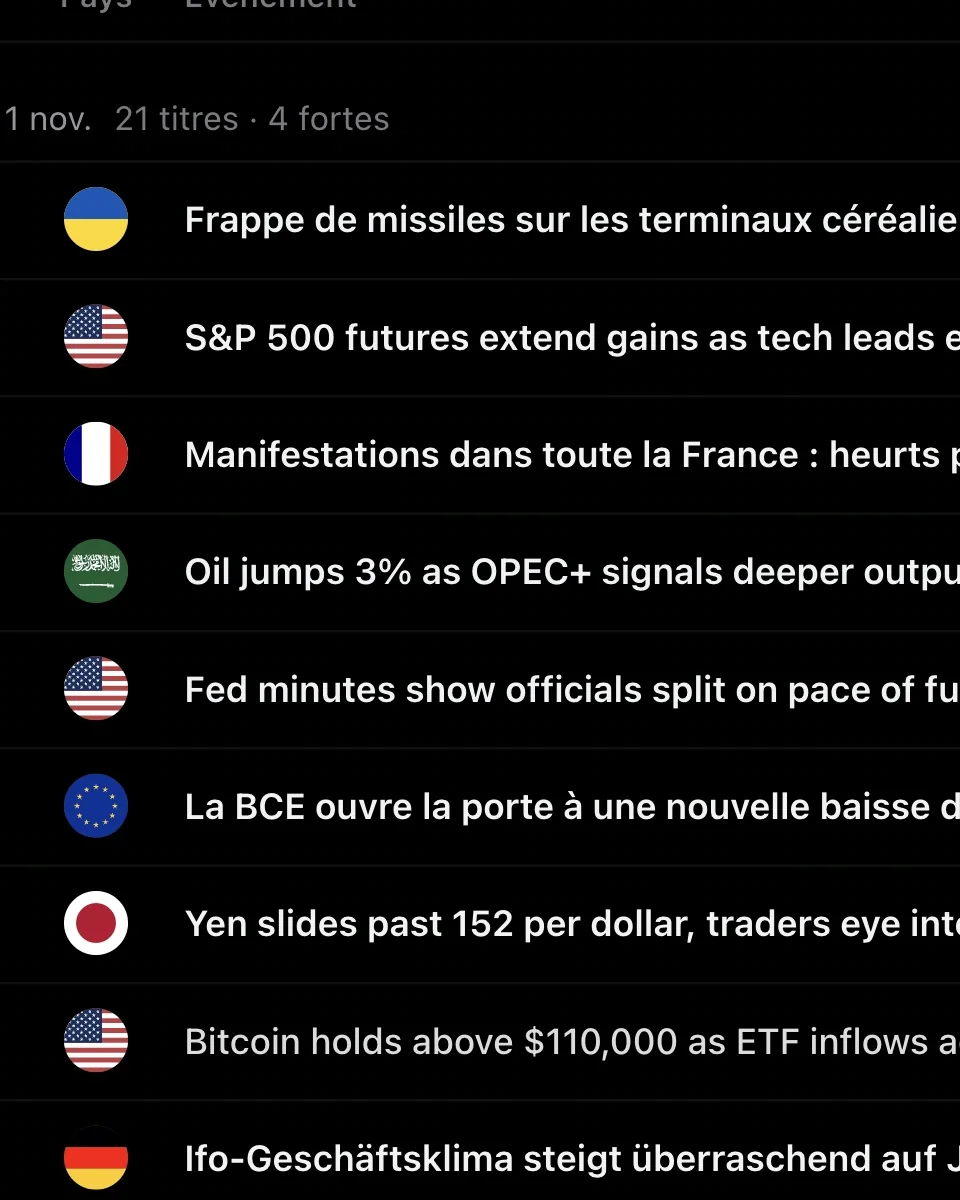 News and calendarEvery headline. Every release.
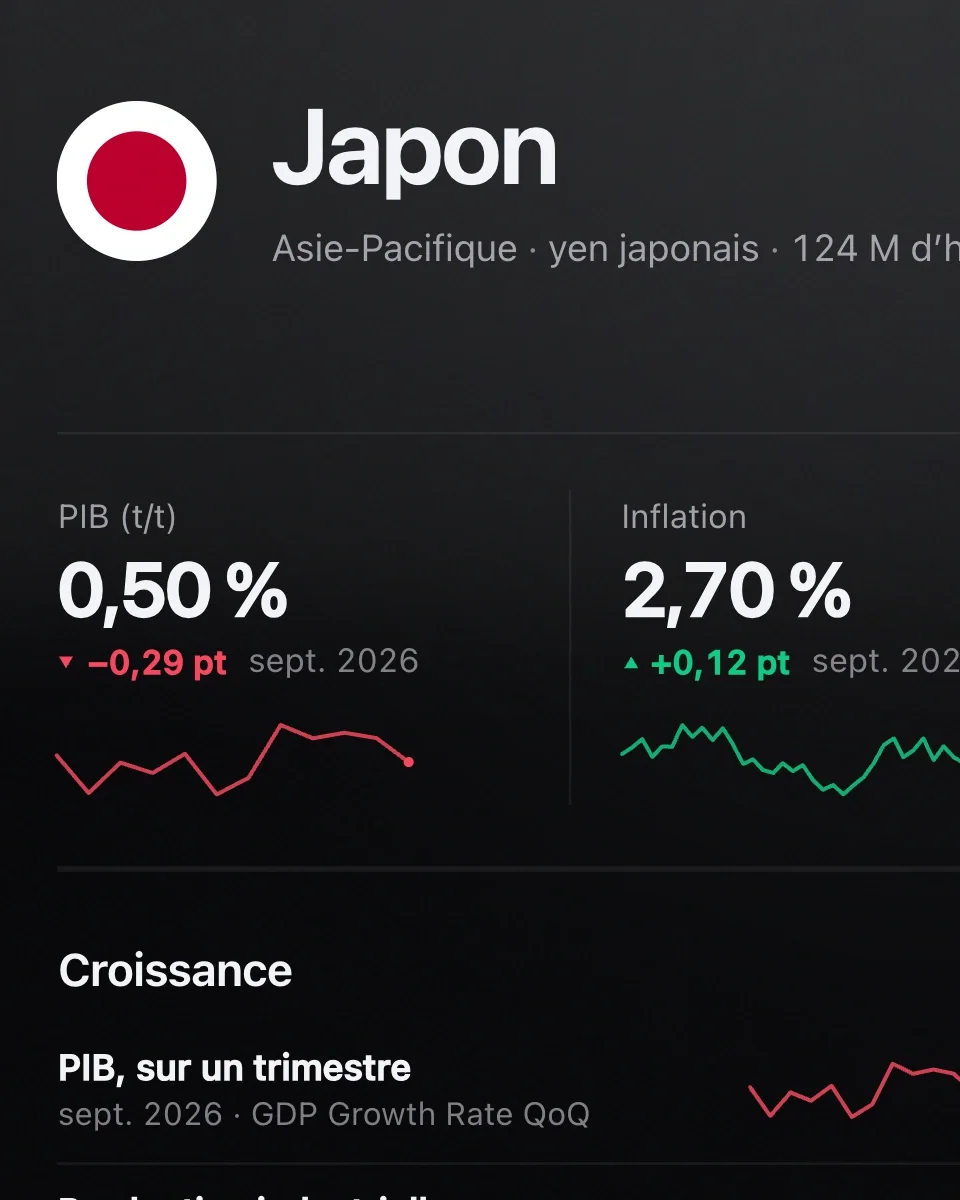 MacroEvery country, at a glance.
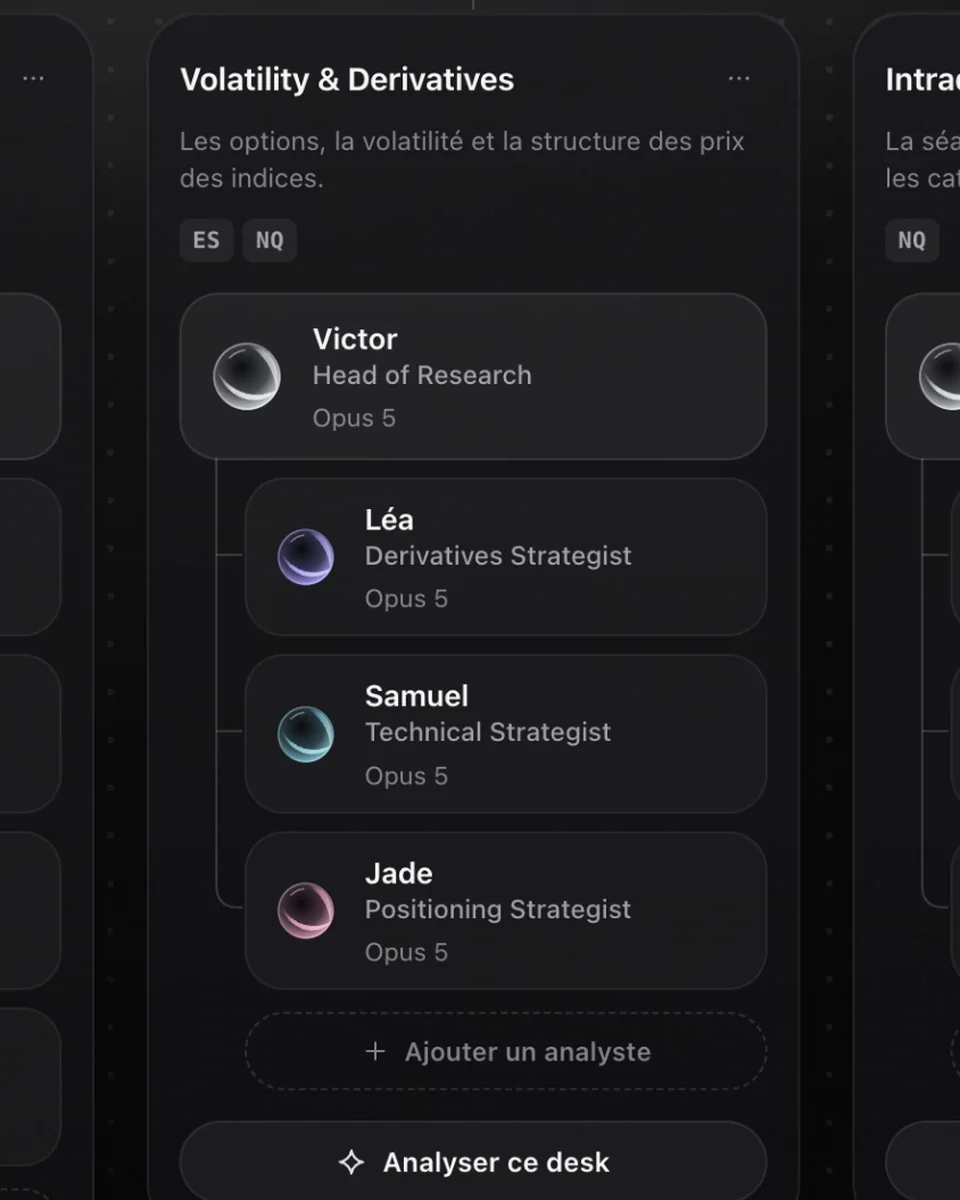 AI DeskYour fund. Your analysts.
Mac and Windows. Free to start, connected to your broker when you’re ready.
Start for free